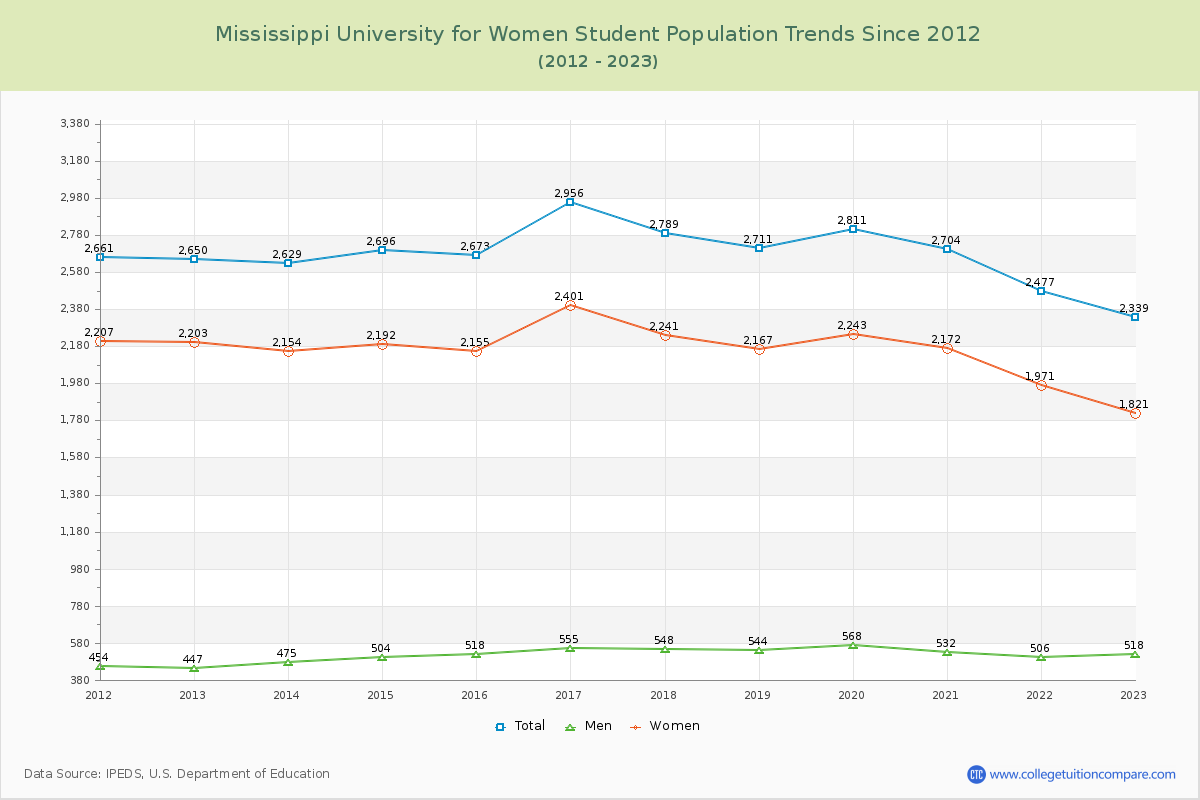
Student Population Changes
The average student population over the last 12 years is 2,676 where 2,339 students are attending the school for the academic year 2022-2023.
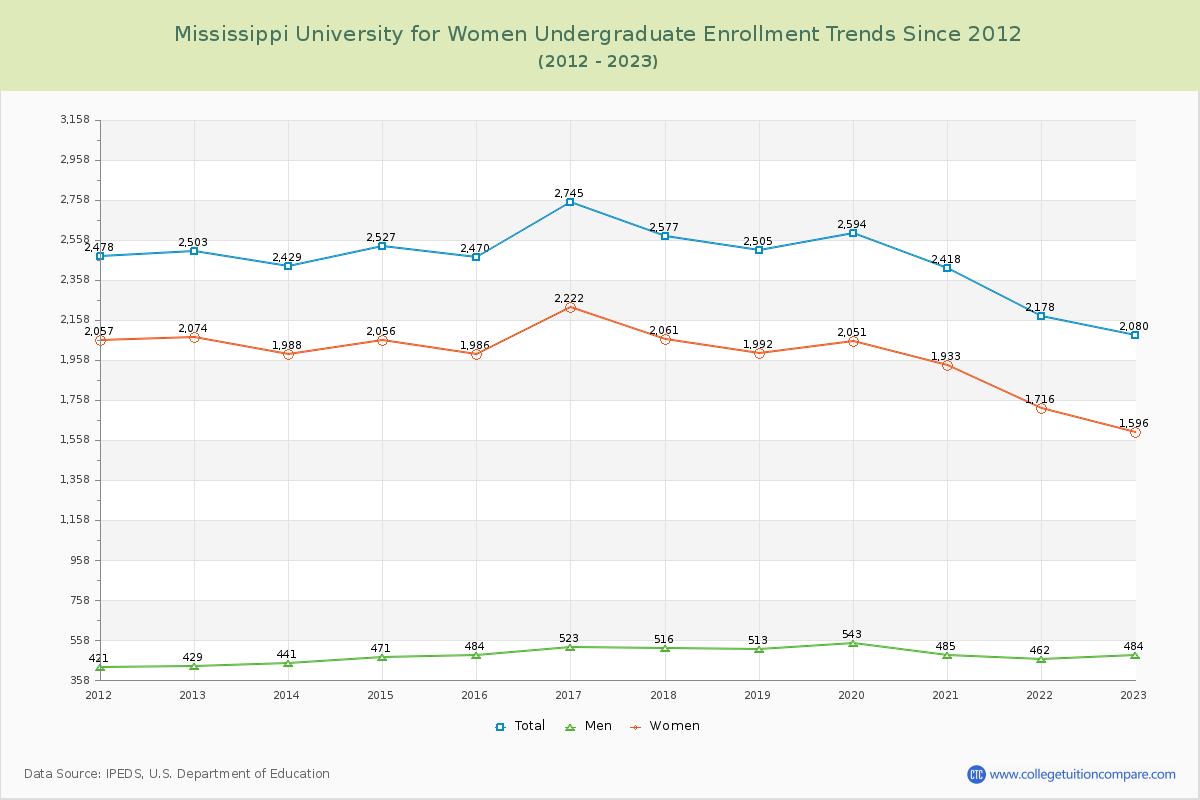
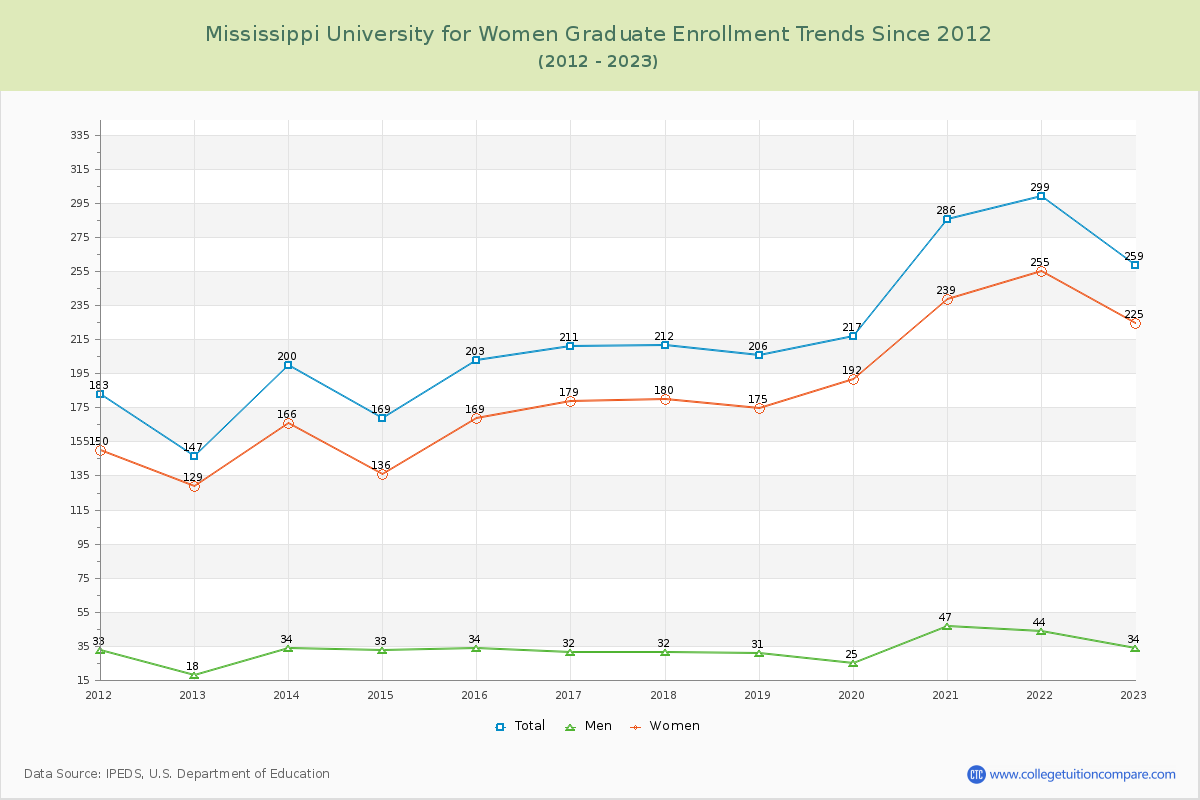
88.93% of total students is undergraduate students and 11.07% students is graduate students. The number of undergraduate students has decreased by 423 and the graduate enrollment has increased by 112 over past 10 years.
The female to male ratio is 3.52 to 1 and it means that there are far more female students enrolled in MUW than male students.
The following table and chart illustrate the changes in student population by gender at Mississippi University for Women since 2012.
| Year | Total | Undergraduate | Graduate | ||||
|---|---|---|---|---|---|---|---|
| Total | Men | Women | Total | Men | Women | ||
| 2012-13 | 2,650 | 2,503 | 429 | 2,074 | 147 | 18 | 129 |
| 2013-14 | 2,629 -21 | 2,429 -74 | 441 12 | 1,988 -86 | 200 53 | 34 16 | 166 37 |
| 2014-15 | 2,696 67 | 2,527 98 | 471 30 | 2,056 68 | 169 -31 | 33 -1 | 136 -30 |
| 2015-16 | 2,673 -23 | 2,470 -57 | 484 13 | 1,986 -70 | 203 34 | 34 1 | 169 33 |
| 2016-17 | 2,956 283 | 2,745 275 | 523 39 | 2,222 236 | 211 8 | 32 -2 | 179 10 |
| 2017-18 | 2,789 -167 | 2,577 -168 | 516 -7 | 2,061 -161 | 212 1 | 32 0 | 180 1 |
| 2018-19 | 2,711 -78 | 2,505 -72 | 513 -3 | 1,992 -69 | 206 -6 | 31 -1 | 175 -5 |
| 2019-20 | 2,811 100 | 2,594 89 | 543 30 | 2,051 59 | 217 11 | 25 -6 | 192 17 |
| 2020-21 | 2,704 -107 | 2,418 -176 | 485 -58 | 1,933 -118 | 286 69 | 47 22 | 239 47 |
| 2021-22 | 2,477 -227 | 2,178 -240 | 462 -23 | 1,716 -217 | 299 13 | 44 -3 | 255 16 |
| 2022-23 | 2,339 -138 | 2,080 -98 | 484 22 | 1,596 -120 | 259 -40 | 34 -10 | 225 -30 |
| Average | 2,676 | 2,457 | 486 | 1,970 | 219 | 33 | 186 |