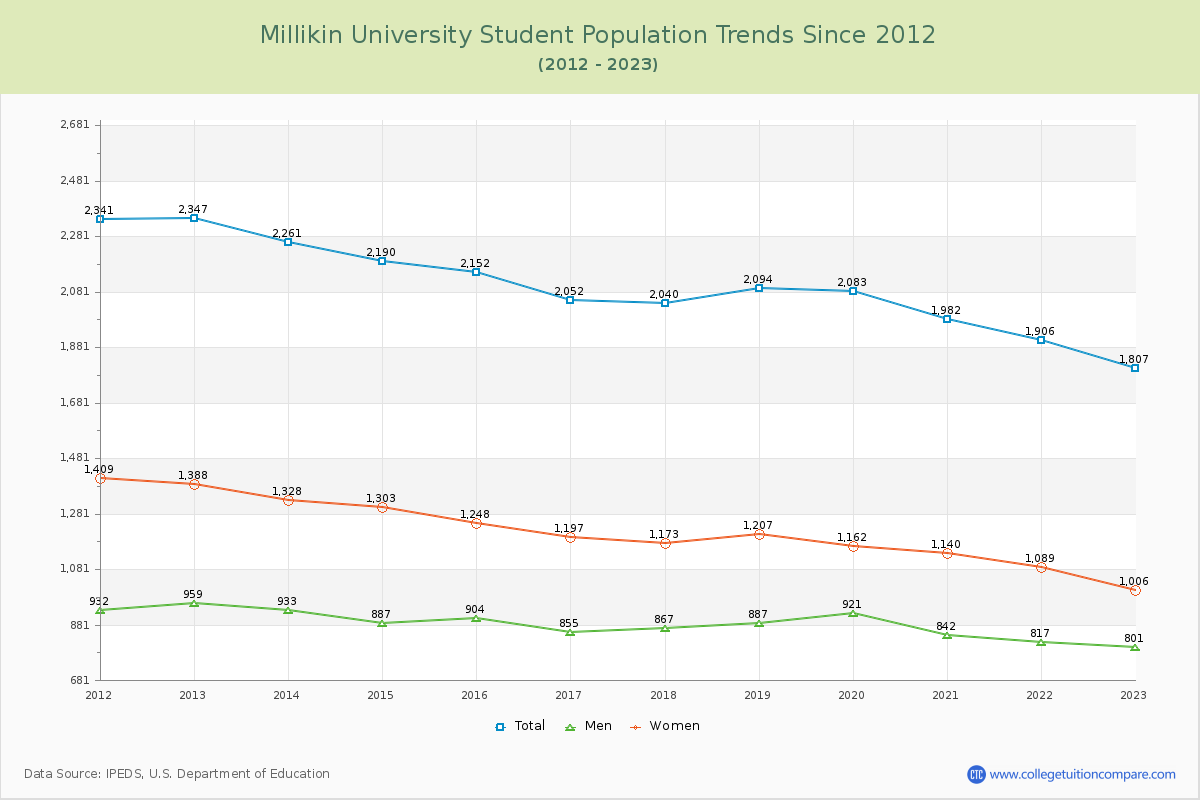
Student Population Changes
The average student population over the last 12 years is 2,083 where 1,807 students are attending the school for the academic year 2022-2023.
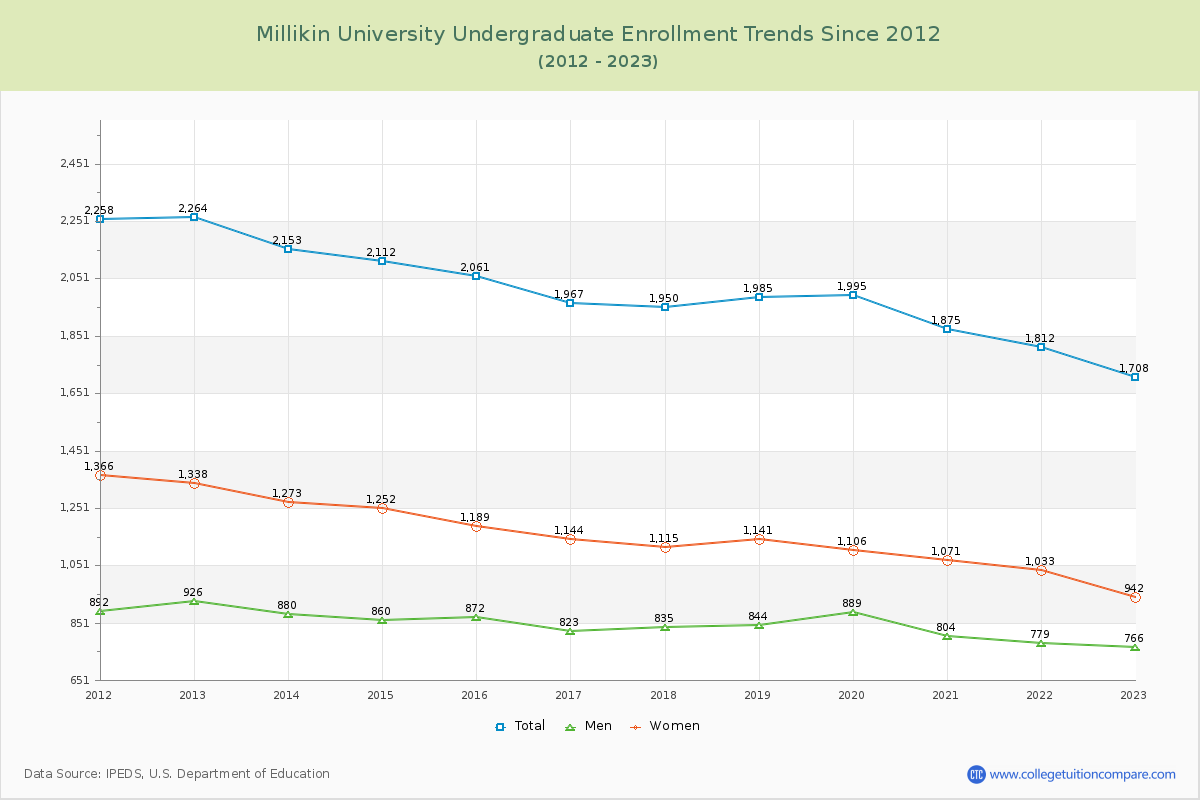
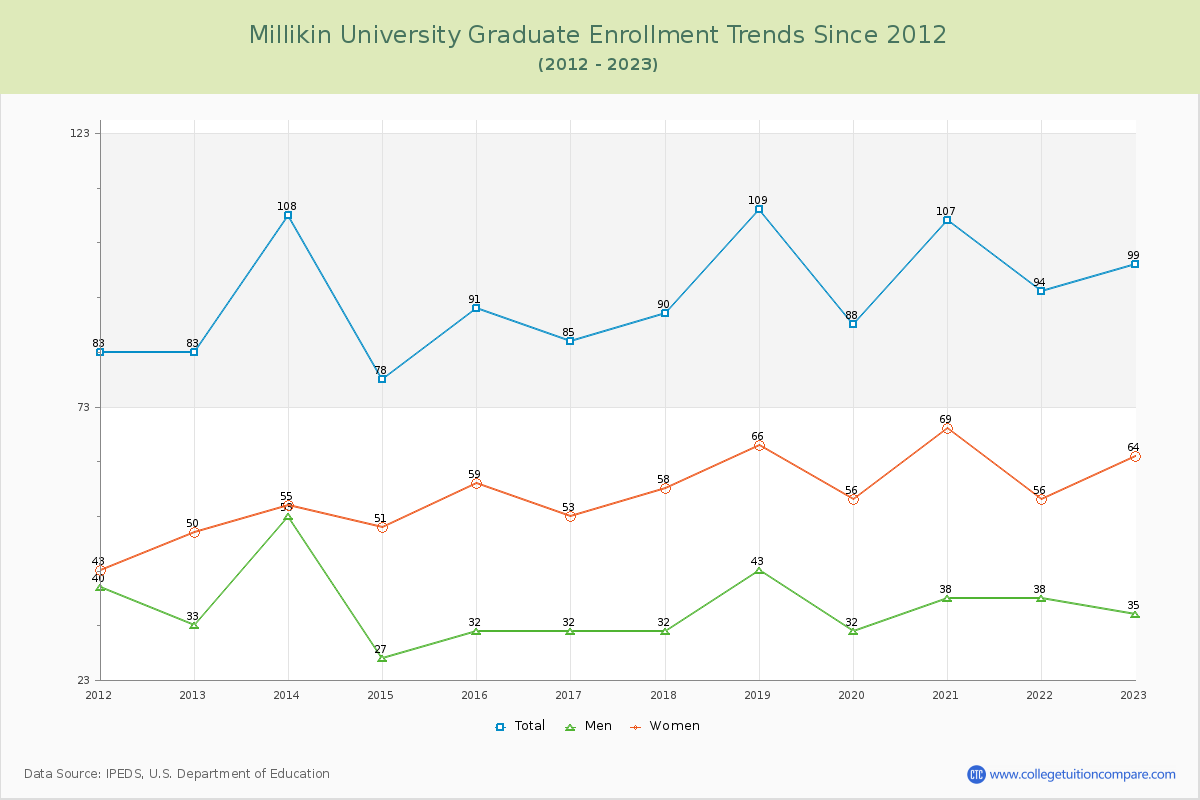
94.52% of total students is undergraduate students and 5.48% students is graduate students. The number of undergraduate students has decreased by 556 and the graduate enrollment has increased by 16 over past 10 years.
The female to male ratio is 1.26 to 1 and it means that there are slightly more female students enrolled in Millikin than male students.
The following table and chart illustrate the changes in student population by gender at Millikin University since 2012.
| Year | Total | Undergraduate | Graduate | ||||
|---|---|---|---|---|---|---|---|
| Total | Men | Women | Total | Men | Women | ||
| 2012-13 | 2,347 | 2,264 | 926 | 1,338 | 83 | 33 | 50 |
| 2013-14 | 2,261 -86 | 2,153 -111 | 880 -46 | 1,273 -65 | 108 25 | 53 20 | 55 5 |
| 2014-15 | 2,190 -71 | 2,112 -41 | 860 -20 | 1,252 -21 | 78 -30 | 27 -26 | 51 -4 |
| 2015-16 | 2,152 -38 | 2,061 -51 | 872 12 | 1,189 -63 | 91 13 | 32 5 | 59 8 |
| 2016-17 | 2,052 -100 | 1,967 -94 | 823 -49 | 1,144 -45 | 85 -6 | 32 0 | 53 -6 |
| 2017-18 | 2,040 -12 | 1,950 -17 | 835 12 | 1,115 -29 | 90 5 | 32 0 | 58 5 |
| 2018-19 | 2,094 54 | 1,985 35 | 844 9 | 1,141 26 | 109 19 | 43 11 | 66 8 |
| 2019-20 | 2,083 -11 | 1,995 10 | 889 45 | 1,106 -35 | 88 -21 | 32 -11 | 56 -10 |
| 2020-21 | 1,982 -101 | 1,875 -120 | 804 -85 | 1,071 -35 | 107 19 | 38 6 | 69 13 |
| 2021-22 | 1,906 -76 | 1,812 -63 | 779 -25 | 1,033 -38 | 94 -13 | 38 0 | 56 -13 |
| 2022-23 | 1,807 -99 | 1,708 -104 | 766 -13 | 942 -91 | 99 5 | 35 -3 | 64 8 |
| Average | 2,083 | 1,989 | 843 | 1,146 | 94 | 36 | 58 |