Enrollment Trends at Miller-Motte College-Chattanooga

4,135

Total Enrollment

961

Men

3,174

Women

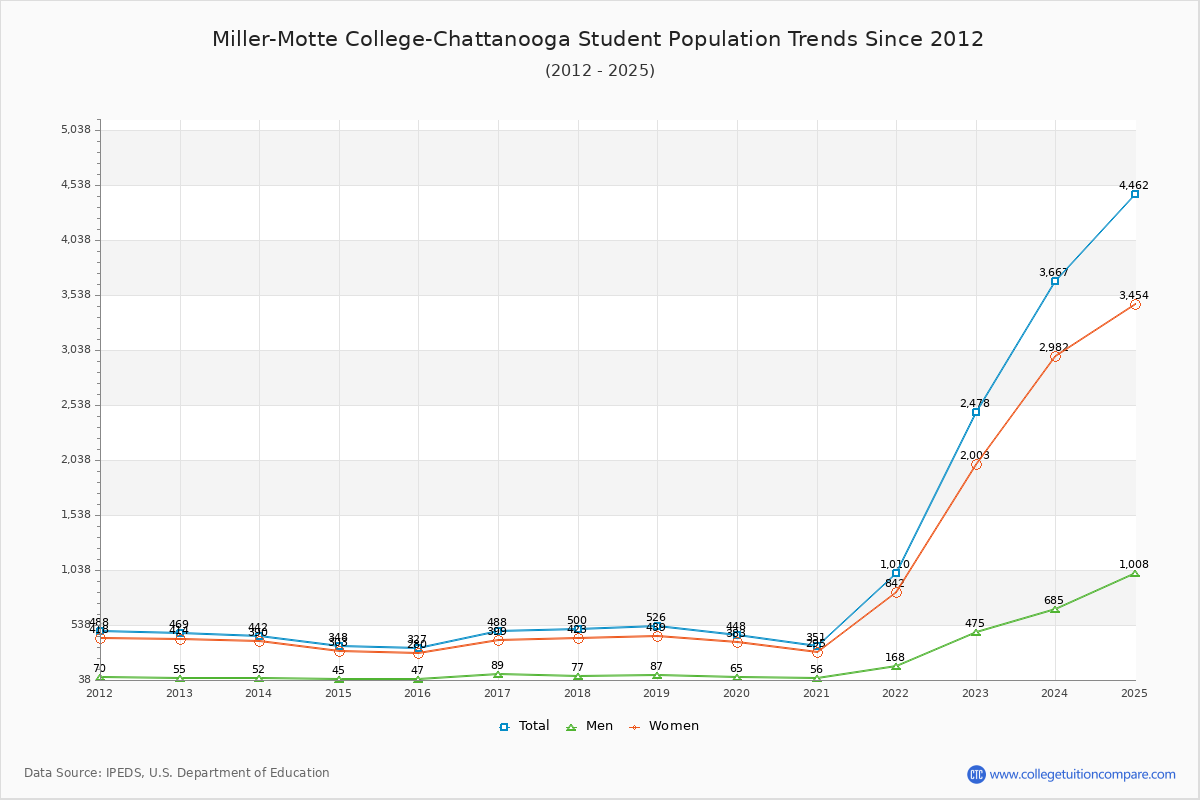
The student population at Miller-Motte College-Chattanooga is 4,462 (all undergraduate). The number of students has increased by 4,135 over the past decade.

The female to male ratio is 3.43 to 1 which means that majority of population is on female students.

4,138 students enrolled in online degree program exclusively and the number of online students has increased by 161.22% since 2015.

Student Population Changes

The average student population over the last 11 years is 1,426 where 4,462 students are attending the school for the academic year 2024-2025.

The female to male ratio is 3.43 to 1 and it means that there are far more female students enrolled in Miller-Motte College-Chattanooga than male students.

The following table and chart illustrate the changes in student population by gender at Miller-Motte College-Chattanooga since 2015.

YearTotalMenWomen
2015-1632747280
2016-17488
161
89
42
399
119
2017-18500
12
77
-12
423
24
2018-19526
26
87
10
439
16
2019-20448
-78
65
-22
383
-56
2020-21351
-97
56
-9
295
-88
2021-221,010
659
168
112
842
547
2022-232,478
1,468
475
307
2,003
1,161
2023-243,667
1,189
685
210
2,982
979
2024-254,462
795
1,008
323
3,454
472
Average1,4262761,150
Miller-Motte College-Chattanooga Enrollment Trends Chart

Enrollment by Race/Ethnicity Changes

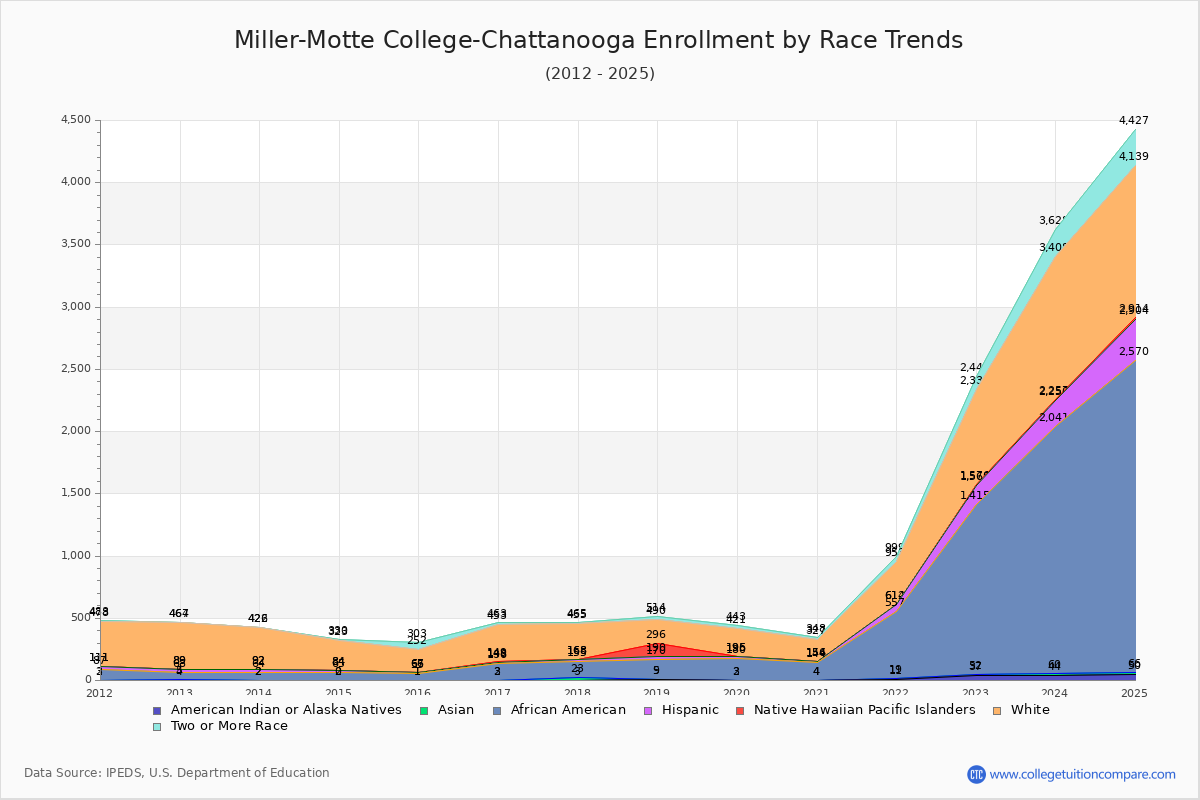
The percentage of white students is 27.45% and the percentage of black students is 56.12% at Miller-Motte College-Chattanooga. 0.36% of enrolled students is Asian. Hispanic students comprise 7.49% of the student body.

Over the past 10 years, the racial composition has shifted. The percentage of white students decreased from 56.57% to 27.45%. Asian enrollment grew from 0.00% to 0.36%. Black student enrollment increased from 16.51% to 56.12%. Hispanic student representation expanded from 3.36% to 7.49%.

The overall racial diversity, measured by the Census Bureau Diversity Index, is 0.5998 which indicates that moderately diverse. This decreased from 0.6272 a decade ago, suggesting that racial diversity has declined.

The following table and chart illustrate the student population trends by race/ethnicity at Miller-Motte College-Chattanooga over the past 11 years (2015-2025).

YearAmerican Indian or Native AmericanAsianBlackHispanicNative Hawaiian or Other Pacific IslanderWhiteTwo or More Races
2015-16105411118551
2016-172113312130410
2017-1832013213028710
2018-19541612010619424
2019-202117715122522
2020-214014010217121
2021-2211853855233946
2022-2337151,3631538760107
2023-2444161,98120971,151220
2024-2550162,504334101,225288
Average168718831448480
Miller-Motte College-Chattanooga Enrollment by Race Trends Chart

Distance Learning (Online Courses) Enrollment Changes

4,138 students are enrolled in online degree programs exclusively for the academic year 2024-2025, which is 93% of total students. The number of online students has increased 161.22% since 2015. The following table and chart illustrate the changes in the online student population by enrolled type at Miller-Motte College-Chattanooga from 2015 to 2025.

YearTotal EnrollmentOnline CompletelyEnrolled in Some Online CoursesNot Enrolled in Online Courses
2015-16327049278
2016-17488090398
2017-185000212288
2018-19526072454
2019-204480175273
2020-213510104247
2021-221,01074171198
2022-232,4782,065153260
2023-243,6673,43192144
2024-254,4624,138128196
Average1,4261,038115274

Ratings & Review

Share your experiences and thoughts about Miller-Motte College-Chattanooga. It will be a great help to applicants and prospective students!