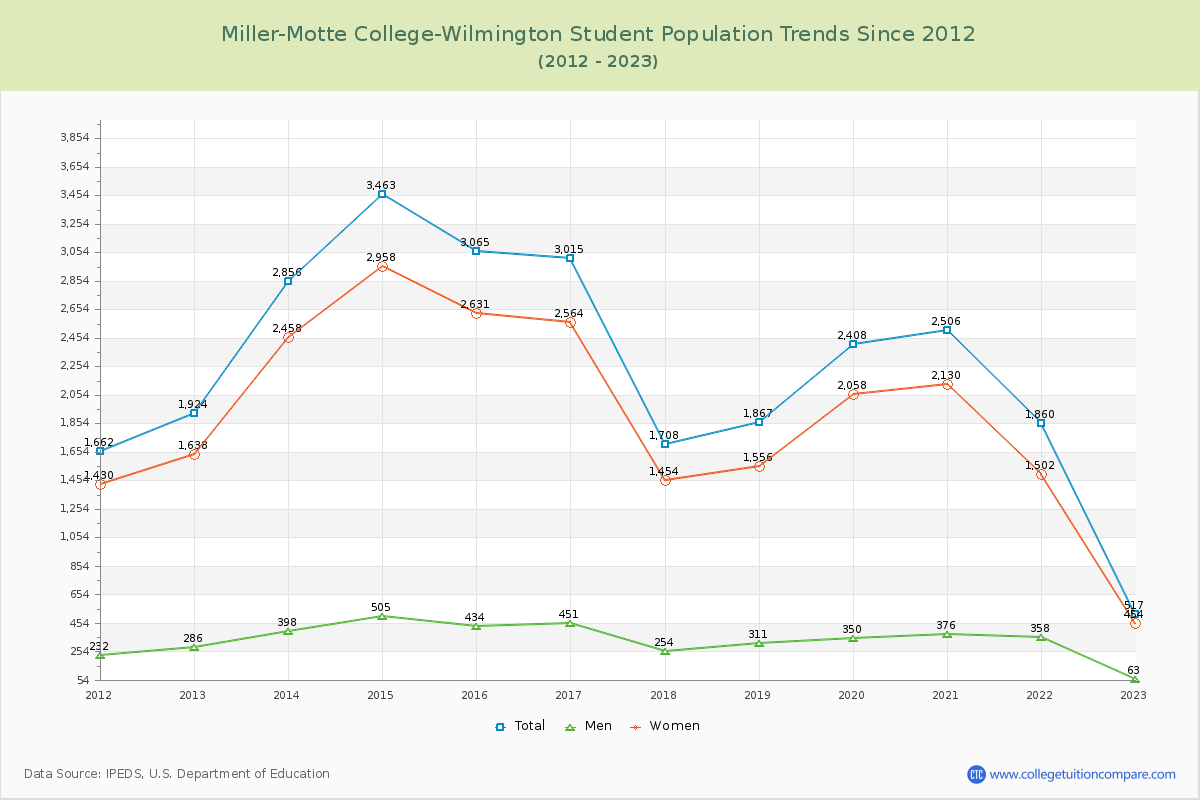
Student Population Changes
The average student population over the last 12 years is 2,290 where 517 students are attending the school for the academic year 2022-2023.
The female to male ratio is 7.21 to 1 and it means that there are far more female students enrolled in Miller-Motte College-Wilmington than male students.
The following table and chart illustrate the changes in student population by gender at Miller-Motte College-Wilmington since 2012.
| Year | Total | Men | Women |
|---|---|---|---|
| 2012-13 | 1,924 | 286 | 1,638 |
| 2013-14 | 2,856 932 | 398 112 | 2,458 820 |
| 2014-15 | 3,463 607 | 505 107 | 2,958 500 |
| 2015-16 | 3,065 -398 | 434 -71 | 2,631 -327 |
| 2016-17 | 3,015 -50 | 451 17 | 2,564 -67 |
| 2017-18 | 1,708 -1,307 | 254 -197 | 1,454 -1,110 |
| 2018-19 | 1,867 159 | 311 57 | 1,556 102 |
| 2019-20 | 2,408 541 | 350 39 | 2,058 502 |
| 2020-21 | 2,506 98 | 376 26 | 2,130 72 |
| 2021-22 | 1,860 -646 | 358 -18 | 1,502 -628 |
| 2022-23 | 517 -1,343 | 63 -295 | 454 -1,048 |
| Average | 2,290 | 344 | 1,946 |