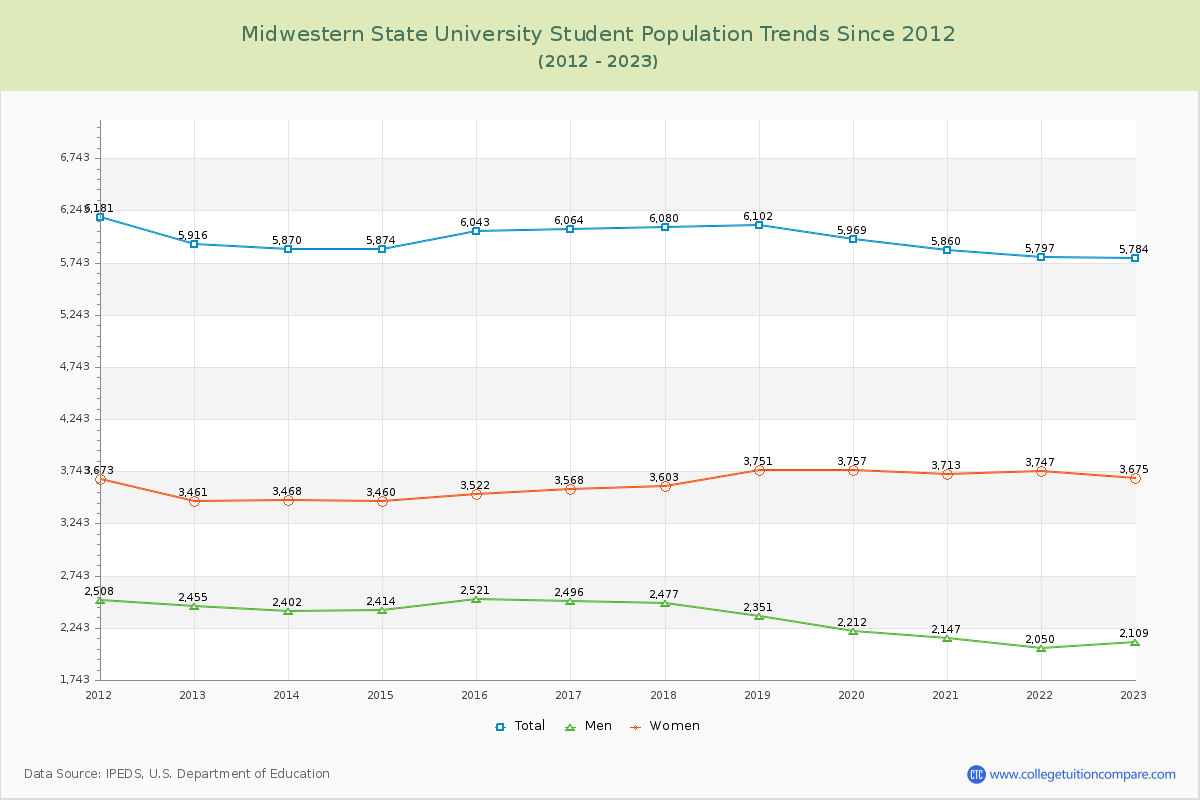
Student Population Changes
The average student population over the last 12 years is 5,942 where 5,784 students are attending the school for the academic year 2022-2023.
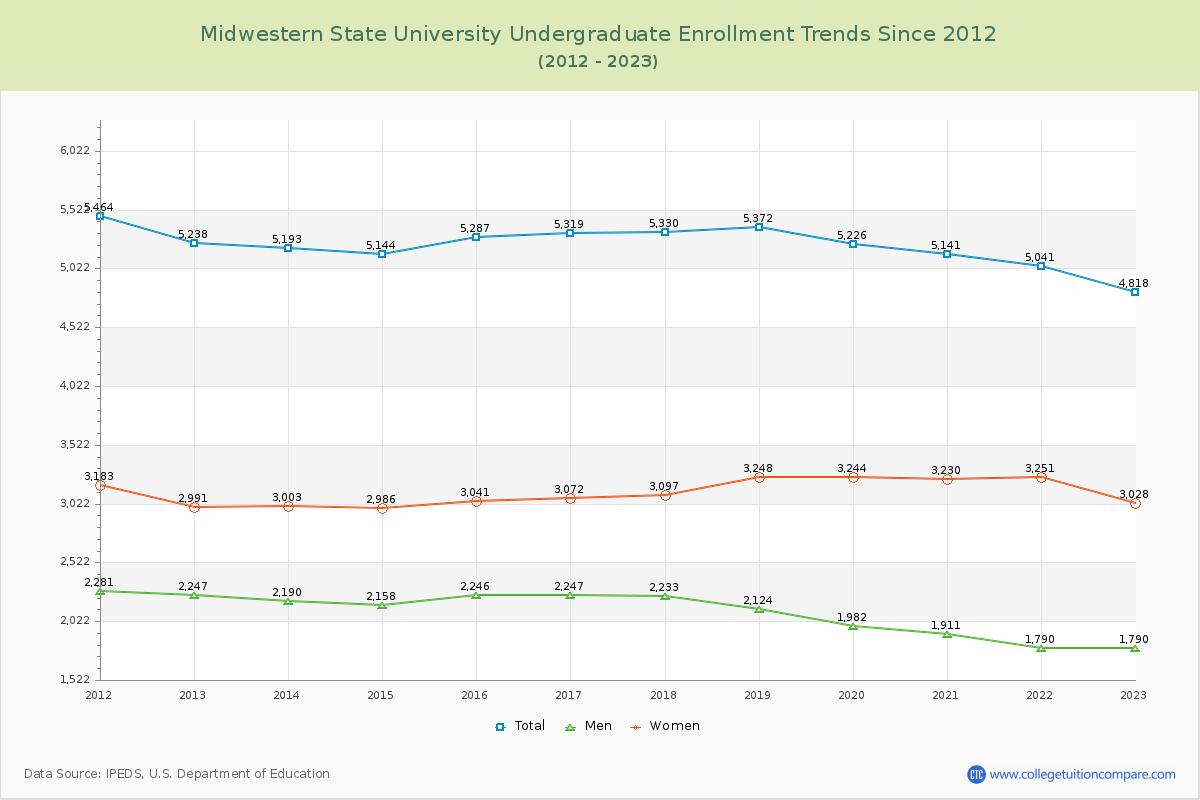
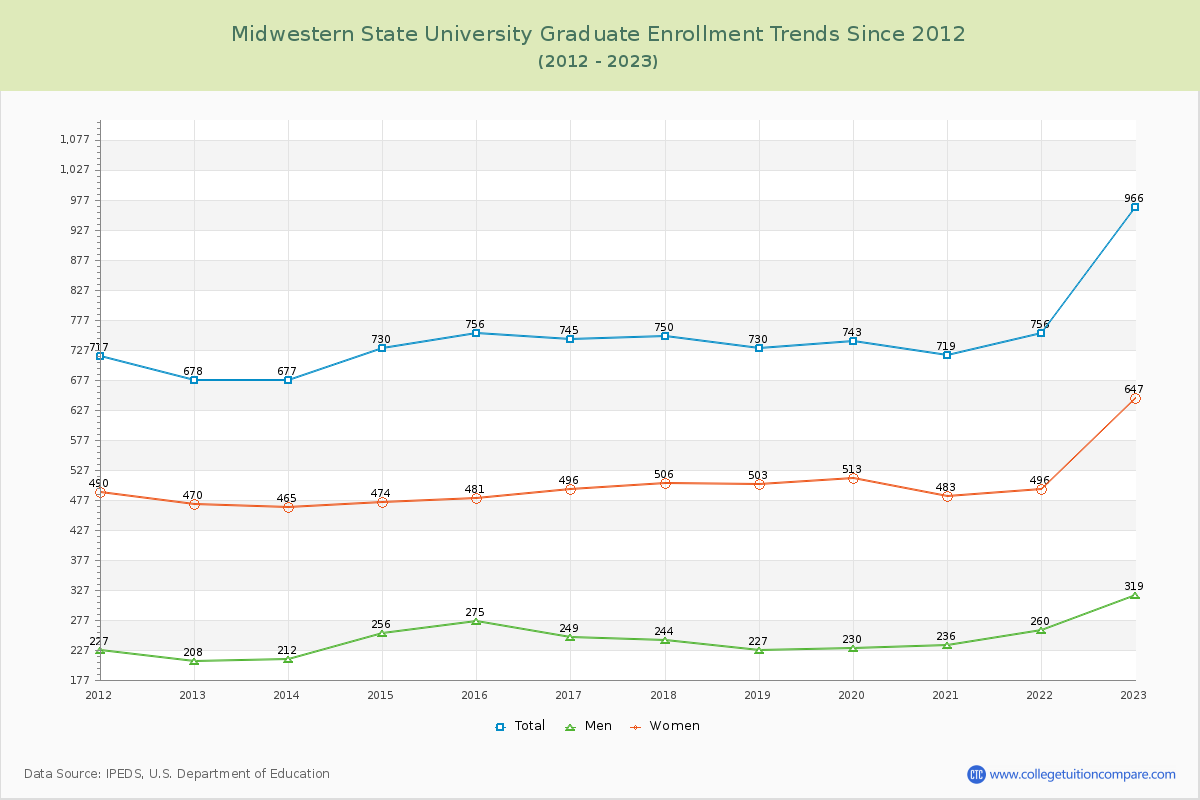
83.30% of total students is undergraduate students and 16.70% students is graduate students. The number of undergraduate students has decreased by 420 and the graduate enrollment has increased by 288 over past 10 years.
The female to male ratio is 1.74 to 1 and it means that there are more female students enrolled in MSU than male students.
The following table and chart illustrate the changes in student population by gender at Midwestern State University since 2012.
| Year | Total | Undergraduate | Graduate | ||||
|---|---|---|---|---|---|---|---|
| Total | Men | Women | Total | Men | Women | ||
| 2012-13 | 5,916 | 5,238 | 2,247 | 2,991 | 678 | 208 | 470 |
| 2013-14 | 5,870 -46 | 5,193 -45 | 2,190 -57 | 3,003 12 | 677 -1 | 212 4 | 465 -5 |
| 2014-15 | 5,874 4 | 5,144 -49 | 2,158 -32 | 2,986 -17 | 730 53 | 256 44 | 474 9 |
| 2015-16 | 6,043 169 | 5,287 143 | 2,246 88 | 3,041 55 | 756 26 | 275 19 | 481 7 |
| 2016-17 | 6,064 21 | 5,319 32 | 2,247 1 | 3,072 31 | 745 -11 | 249 -26 | 496 15 |
| 2017-18 | 6,080 16 | 5,330 11 | 2,233 -14 | 3,097 25 | 750 5 | 244 -5 | 506 10 |
| 2018-19 | 6,102 22 | 5,372 42 | 2,124 -109 | 3,248 151 | 730 -20 | 227 -17 | 503 -3 |
| 2019-20 | 5,969 -133 | 5,226 -146 | 1,982 -142 | 3,244 -4 | 743 13 | 230 3 | 513 10 |
| 2020-21 | 5,860 -109 | 5,141 -85 | 1,911 -71 | 3,230 -14 | 719 -24 | 236 6 | 483 -30 |
| 2021-22 | 5,797 -63 | 5,041 -100 | 1,790 -121 | 3,251 21 | 756 37 | 260 24 | 496 13 |
| 2022-23 | 5,784 -13 | 4,818 -223 | 1,790 0 | 3,028 -223 | 966 210 | 319 59 | 647 151 |
| Average | 5,942 | 5,192 | 2,083 | 3,108 | 750 | 247 | 503 |