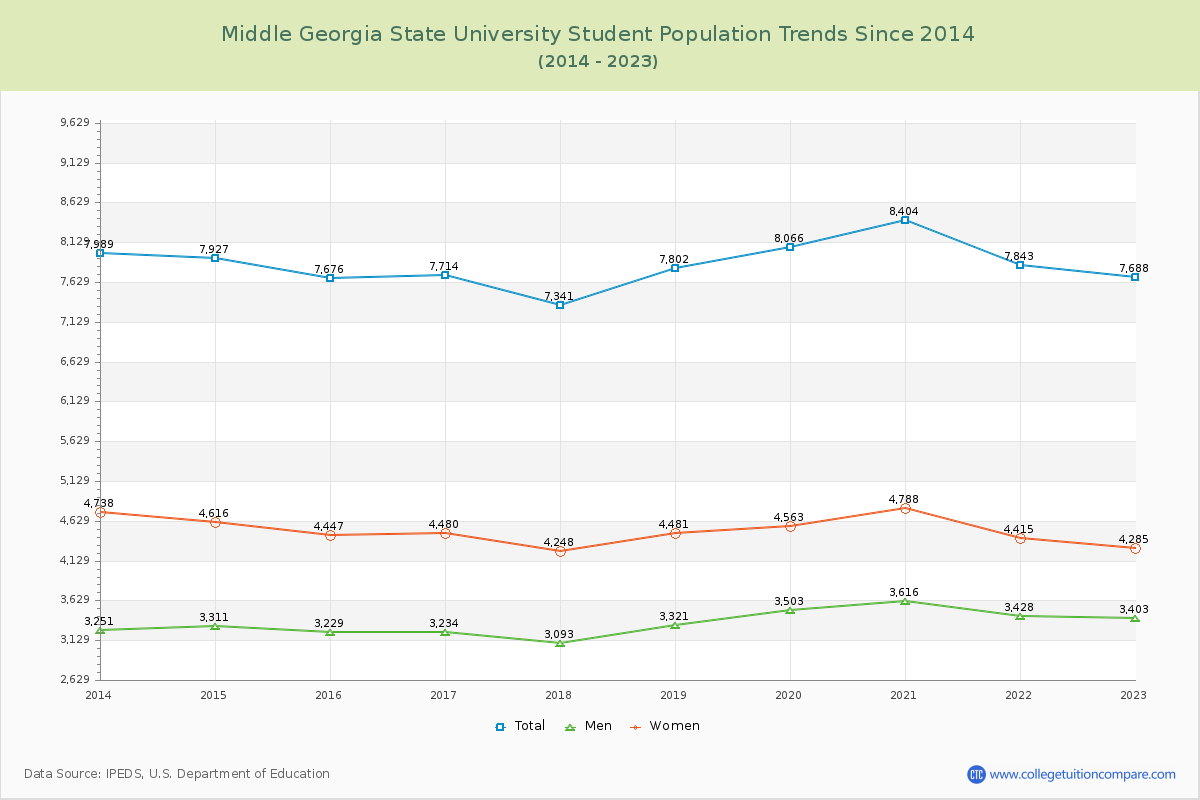
Student Population Changes
The average student population over the last 11 years is 7,845 where 7,688 students are attending the school for the academic year 2022-2023.
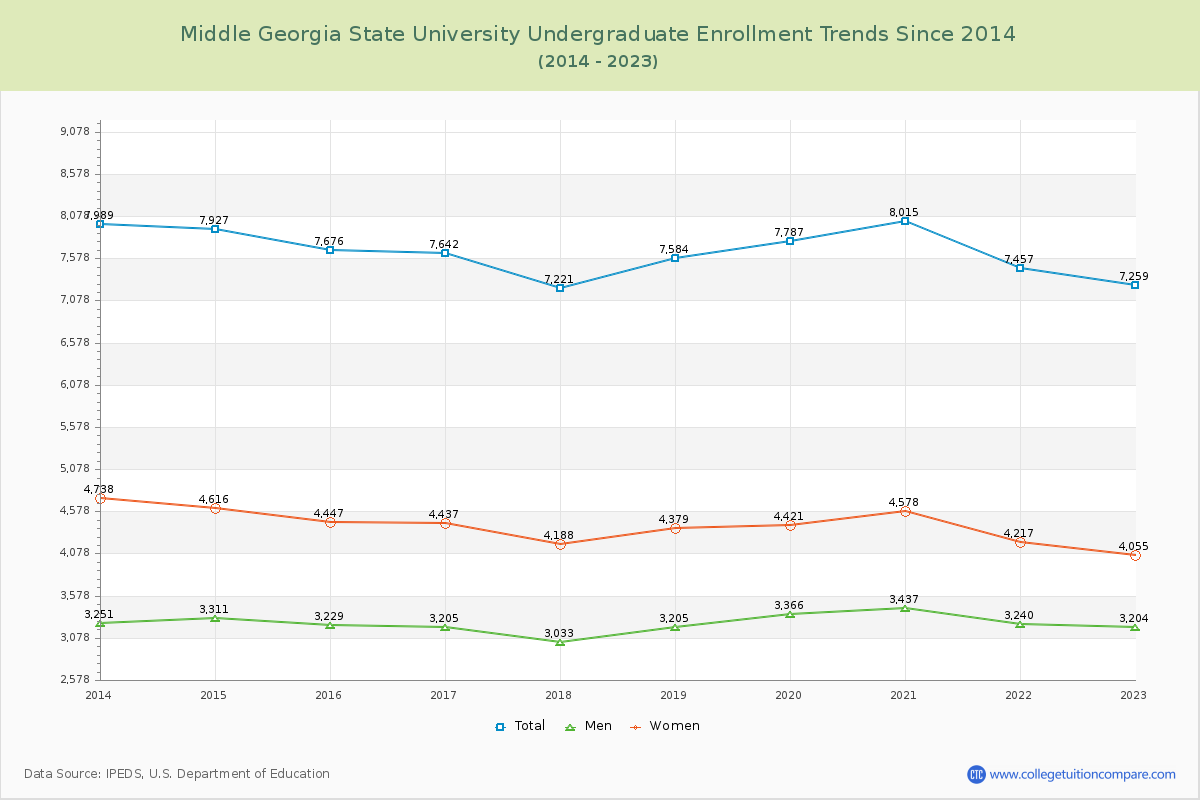
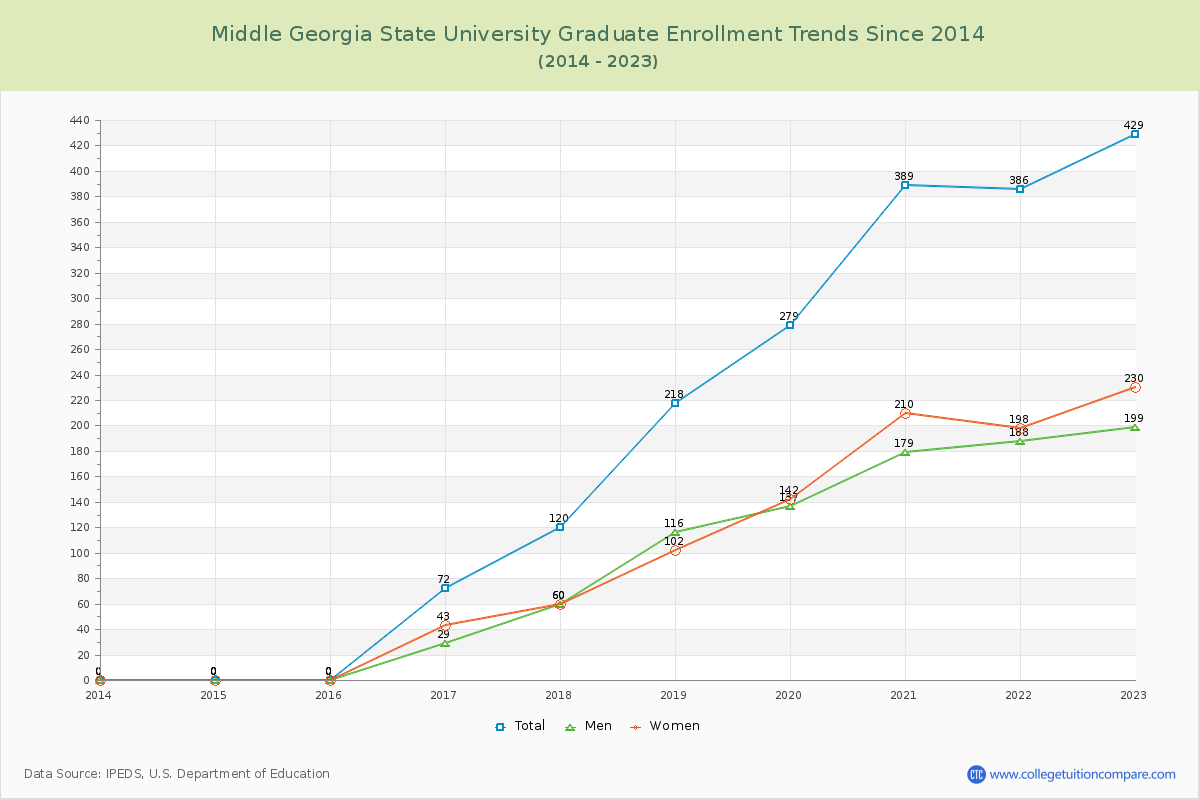
94.42% of total students is undergraduate students and 5.58% students is graduate students. The number of undergraduate students has decreased by 730 and the graduate enrollment has increased by 429 over past 10 years.
The female to male ratio is 1.26 to 1 and it means that there are slightly more female students enrolled in Middle Georgia State than male students.
The following table and chart illustrate the changes in student population by gender at Middle Georgia State University since 2013.
| Year | Total | Undergraduate | Graduate | ||||
|---|---|---|---|---|---|---|---|
| Total | Men | Women | Total | Men | Women | ||
| 2013-14 | 7,989 | 7,989 | 3,251 | 4,738 | 0 | 0 | 0 |
| 2014-15 | 7,927 -62 | 7,927 -62 | 3,311 60 | 4,616 -122 | 0 0 | 0 0 | 0 0 |
| 2015-16 | 7,676 -251 | 7,676 -251 | 3,229 -82 | 4,447 -169 | 0 0 | 0 0 | 0 0 |
| 2016-17 | 7,714 38 | 7,642 -34 | 3,205 -24 | 4,437 -10 | 72 72 | 29 29 | 43 43 |
| 2017-18 | 7,341 -373 | 7,221 -421 | 3,033 -172 | 4,188 -249 | 120 48 | 60 31 | 60 17 |
| 2018-19 | 7,802 461 | 7,584 363 | 3,205 172 | 4,379 191 | 218 98 | 116 56 | 102 42 |
| 2019-20 | 8,066 264 | 7,787 203 | 3,366 161 | 4,421 42 | 279 61 | 137 21 | 142 40 |
| 2020-21 | 8,404 338 | 8,015 228 | 3,437 71 | 4,578 157 | 389 110 | 179 42 | 210 68 |
| 2021-22 | 7,843 -561 | 7,457 -558 | 3,240 -197 | 4,217 -361 | 386 -3 | 188 9 | 198 -12 |
| 2022-23 | 7,688 -155 | 7,259 -198 | 3,204 -36 | 4,055 -162 | 429 43 | 199 11 | 230 32 |
| Average | 7,845 | 7,656 | 3,248 | 4,408 | 189 | 91 | 99 |