Enrollment Trends at MidAmerica Nazarene

-346

Total Enrollment

-13

Men

-333

Women

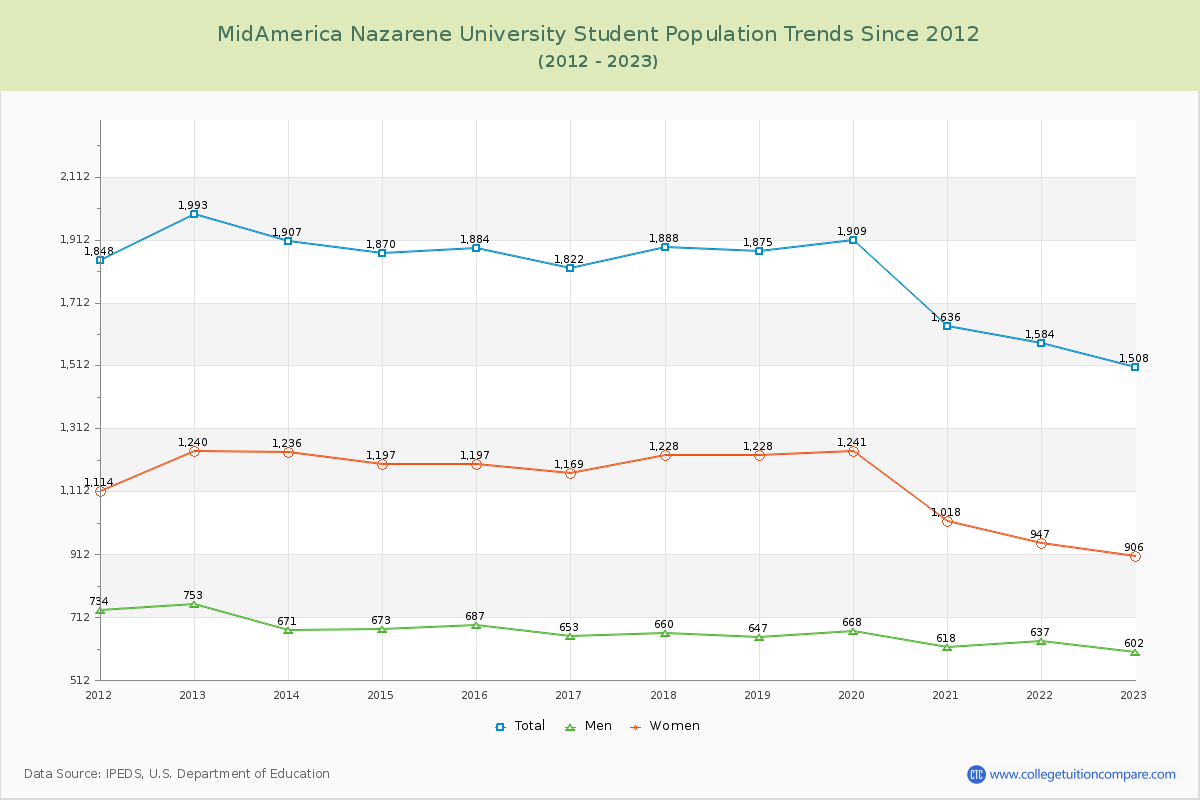
The student population at MidAmerica Nazarene University is 1,538 (1,204 undergraduate and 334 graduate students) . The number of students has decreased by 346 over the past decade.

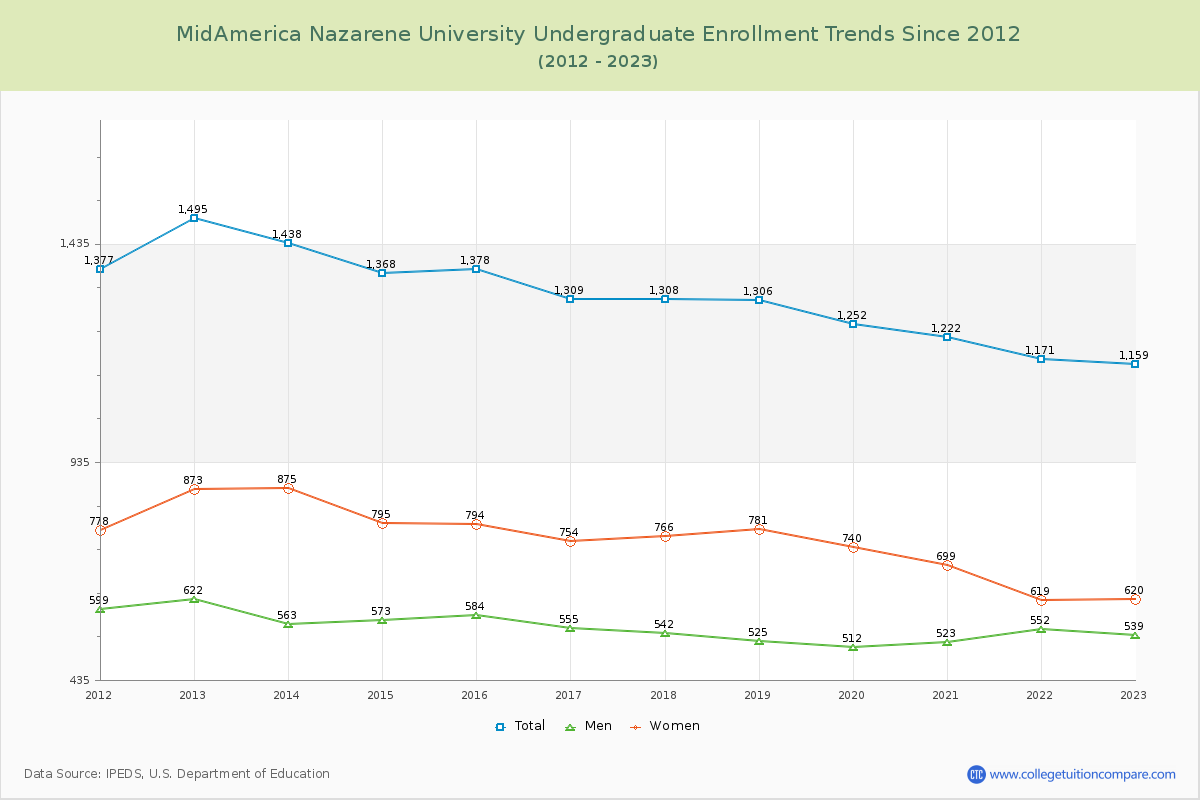
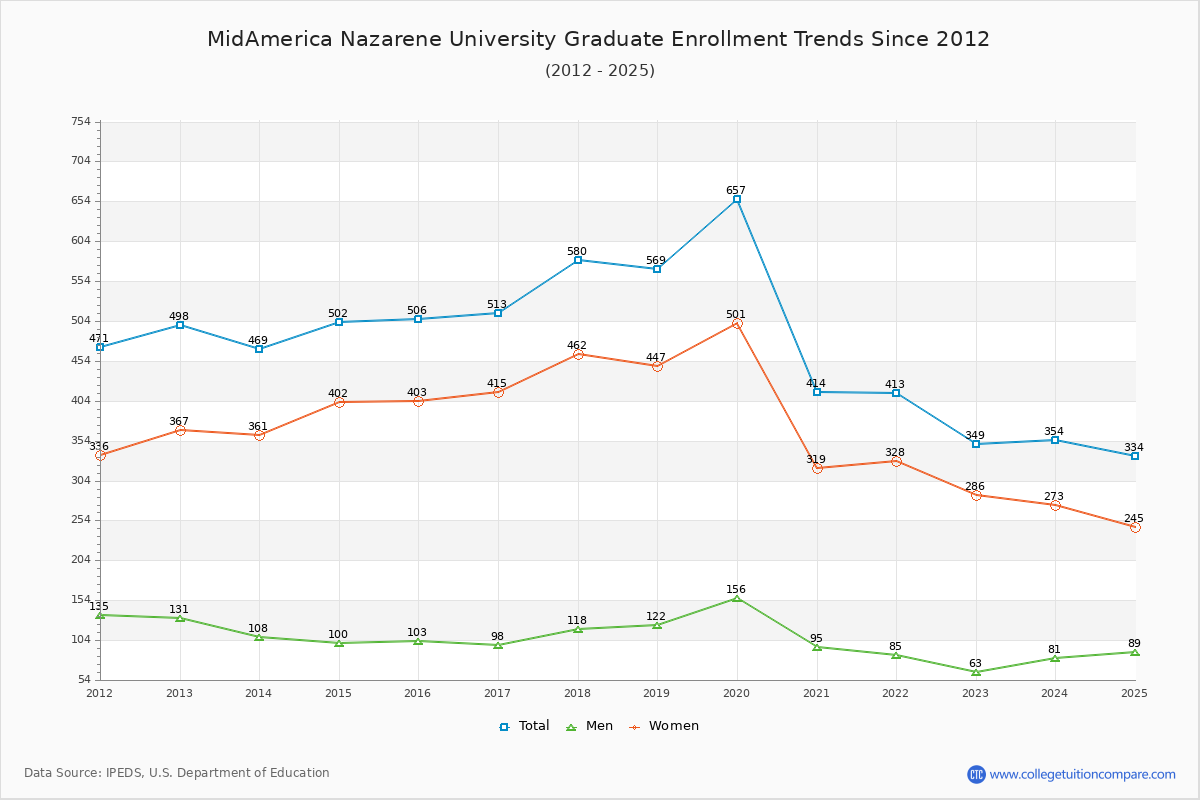
The percentage of undergraduate students at MidAmerica Nazarene is 78.28% which is decreased by 174 over last 10 years. The graduate student population decreased by 172 and it has been decreasing.

The female to male ratio is 1.28 to 1 which means that female students enrolled slightly more than male students.

143 students enrolled in online degree program exclusively and the number of online students has decreased by -47.43% since 2015.

Student Population Changes

The average student population over the last 11 years is 1,718 where 1,538 students are attending the school for the academic year 2024-2025.

78.28% of total students is undergraduate students and 21.72% students is graduate students. The number of undergraduate students has decreased by 174 and the graduate enrollment has decreased by 172 over past 10 years.

The female to male ratio is 1.28 to 1 and it means that there are slightly more female students enrolled in MidAmerica Nazarene than male students.

The following table and chart illustrate the changes in student population by gender at MidAmerica Nazarene University since 2015.

YearTotalUndergraduateGraduate
TotalMenWomenTotalMenWomen
2015-161,8841,378584794506103403
2016-171,822
-62
1,309
-69
555
-29
754
-40
513
7
98
-5
415
12
2017-181,888
66
1,308
-1
542
-13
766
12
580
67
118
20
462
47
2018-191,875
-13
1,306
-2
525
-17
781
15
569
-11
122
4
447
-15
2019-201,909
34
1,252
-54
512
-13
740
-41
657
88
156
34
501
54
2020-211,636
-273
1,222
-30
523
11
699
-41
414
-243
95
-61
319
-182
2021-221,584
-52
1,171
-51
552
29
619
-80
413
-1
85
-10
328
9
2022-231,508
-76
1,159
-12
539
-13
620
1
349
-64
63
-22
286
-42
2023-241,539
31
1,185
26
563
24
622
2
354
5
81
18
273
-13
2024-251,538
-1
1,204
19
585
22
619
-3
334
-20
89
8
245
-28
Average1,7181,249548701469101368
MidAmerica Nazarene University Enrollment Trends Chart

Undergraduate Enrollment Changes

The average number of Undergraduate students over the last 11 years is 1,249 where 1,204 students are attending the Undergraduate school for the academic year 2024-2025. The following table and chart illustrate the changes in Undergraduate enrollment by attending status and gender at MidAmerica Nazarene University since 2015.

YearTotalFull-timePart-time
TotalMenWomenTotalMenWomen
2015-161,3781,068474594310110200
2016-171,3091,001448553308107201
2017-181,308998430568310112198
2018-191,306982402580324123201
2019-201,252938397541314115199
2020-211,22295943152826392171
2021-221,171906439467265113152
2022-231,159923439484236100136
2023-241,185923452471262111151
2024-251,204945469476259116143
Average1,2491,2494385261,249110175
MidAmerica Nazarene University Undergraduate Enrollment Trends Chart

Graduate Enrollment Changes

The average number of Graduate students over the last 11 years is 469 where 334 students are attending the Graduate school for the academic year 2024-2025. The following table and chart illustrate the changes in Graduate enrollment by attending status and gender at MidAmerica Nazarene University since 2015.

YearTotalFull-timePart-time
TotalMenWomenTotalMenWomen
2015-16506105149140189312
2016-175131512712436271291
2017-185801532412942794333
2018-19569871473482108374
2019-2065714637109511119392
2020-21414103297431166245
2021-2241391256632260262
2022-2334969165328047233
2023-2435491207126361202
2024-2533469224726567198
Average469469238446978284
MidAmerica Nazarene University Graduate Enrollment Trends Chart

Enrollment by Race/Ethnicity Changes

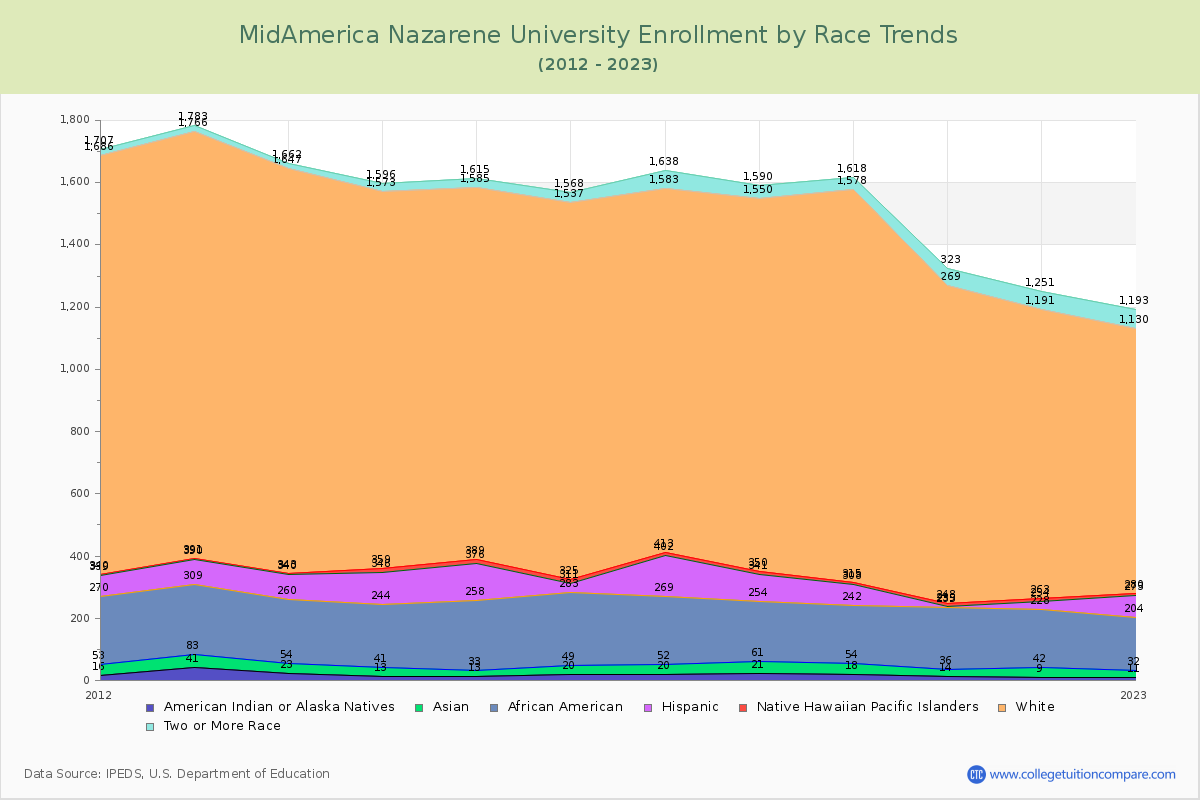
The percentage of white students is 63.52%. The percentage was 63.48% 10 years ago and MidAmerica Nazarene still has a high percentage of white students. 1.63% of enrolled students is Asian and 11.96% is black students. Hispanic students comprise 8.78% of the student body.

Over the past 10 years, the racial composition has shifted. The percentage of white students increased from 63.48% to 63.52%. Asian enrollment grew from 1.06% to 1.63%. Black student enrollment increased from 11.94% to 11.96%. Hispanic student representation expanded from 6.26% to 8.78%.

The overall racial diversity, measured by the Census Bureau Diversity Index, is 0.5697 which indicates that moderately diverse. This decreased from 0.5784 a decade ago, suggesting that racial diversity has declined.

The following table and chart illustrate the student population trends by race/ethnicity at MidAmerica Nazarene University over the past 11 years (2015-2025).

YearAmerican Indian or Native AmericanAsianBlackHispanicNative Hawaiian or Other Pacific IslanderWhiteTwo or More Races
2015-161320225118131,19630
2016-17202923428141,21231
2017-182032217133111,17055
2018-1921401938791,20040
2019-2018361886671,26340
2020-211422199491,02154
2021-2293318626992860
2022-23112117269785063
2023-241423184103485473
2024-259251841354977103
Average15281987791,06755
MidAmerica Nazarene University Enrollment by Race Trends Chart

Distance Learning (Online Courses) Enrollment Changes

143 students are enrolled in online degree programs exclusively for the academic year 2024-2025, which is 9% of total students. The number of online students has decreased -47.43% since 2015. The following table and chart illustrate the changes in the online student population by enrolled type at MidAmerica Nazarene University from 2015 to 2025.

YearTotal EnrollmentOnline CompletelyEnrolled in Some Online CoursesNot Enrolled in Online Courses
2015-161,8842721461,466
2016-171,8223531421,327
2017-181,8883331901,365
2018-191,8753502581,267
2019-201,9097041371,068
2020-211,6362433471,046
2021-221,5842182141,152
2022-231,5081511941,163
2023-241,5391432461,150
2024-251,5381432271,168
Average1,7182912101,217

Ratings & Review

Share your experiences and thoughts about MidAmerica Nazarene University. It will be a great help to applicants and prospective students!