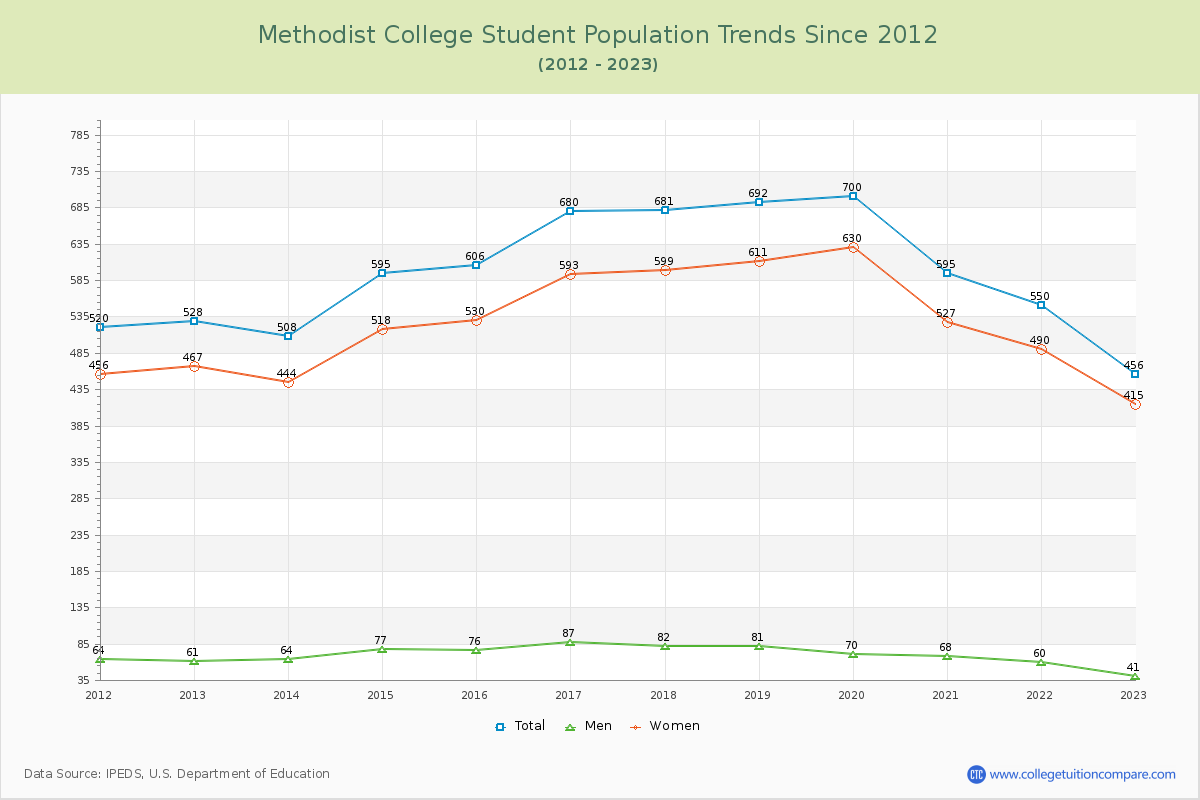
Student Population Changes
The average student population over the last 12 years is 599 where 456 students are attending the school for the academic year 2022-2023.
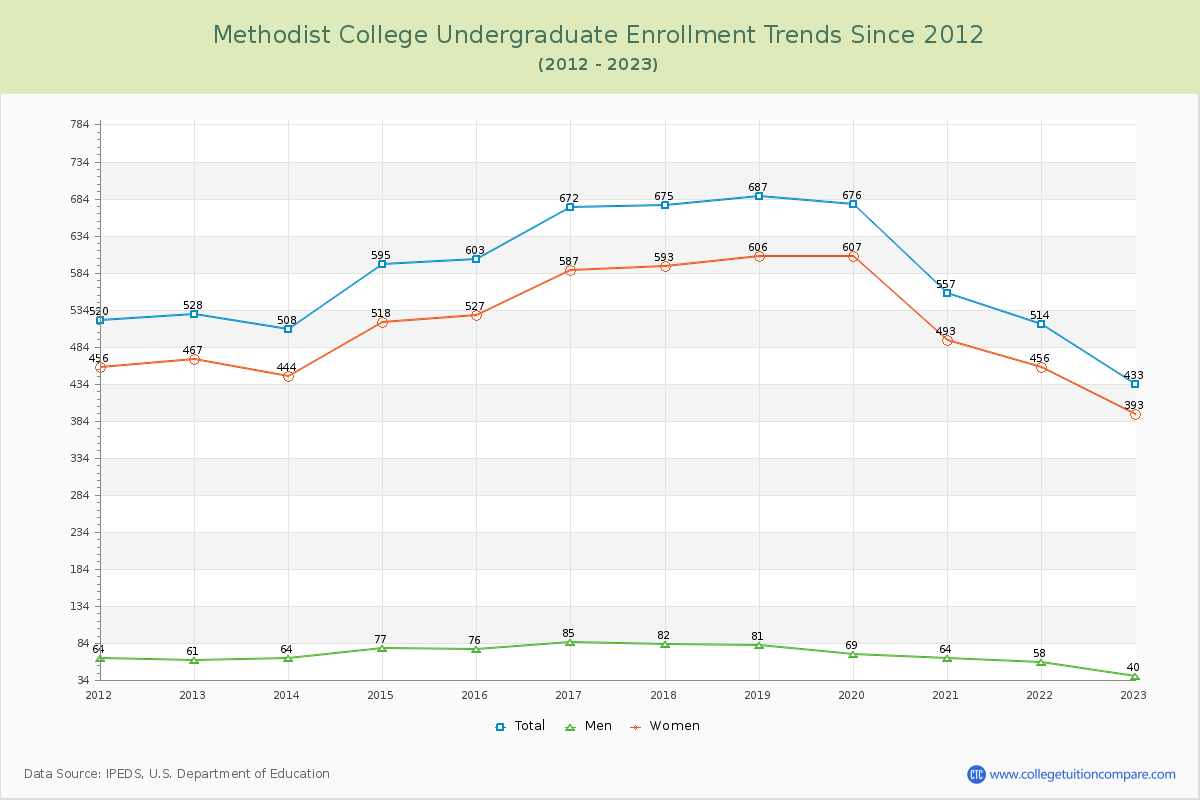
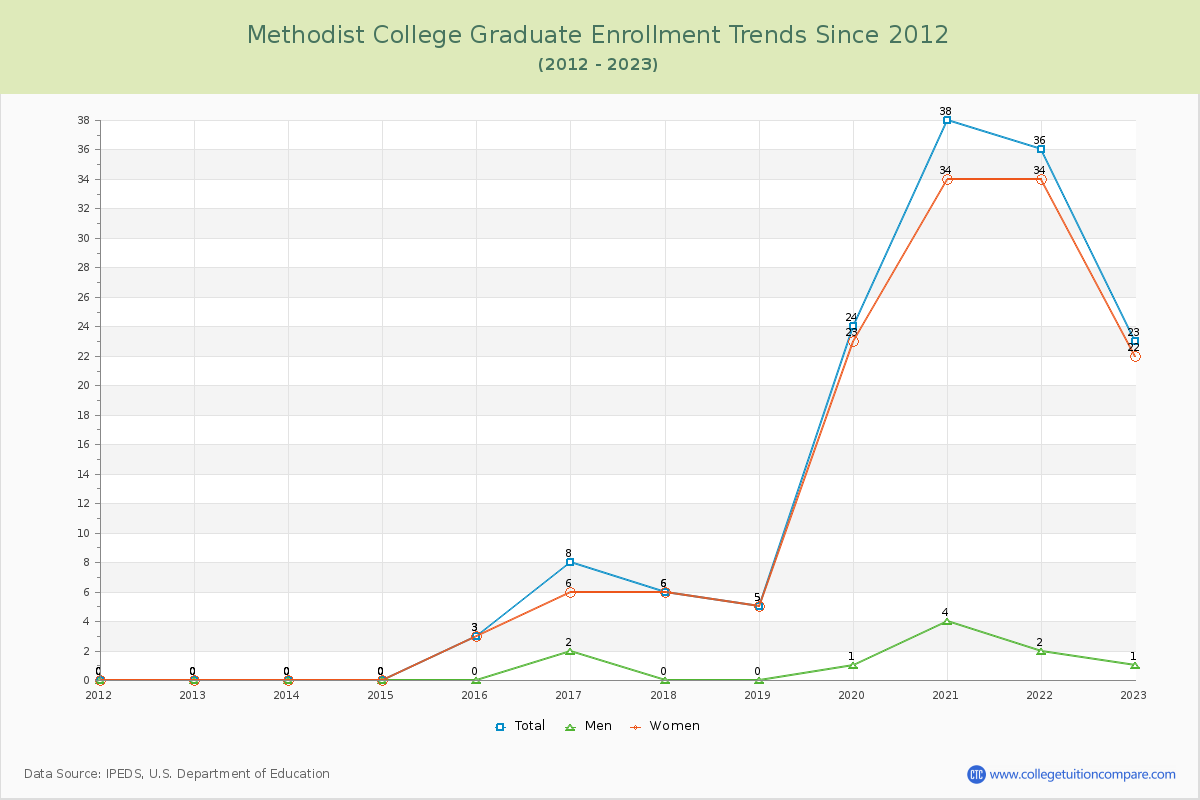
94.96% of total students is undergraduate students and 5.04% students is graduate students. The number of undergraduate students has decreased by 95 and the graduate enrollment has increased by 23 over past 10 years.
The female to male ratio is 10.12 to 1 and it means that there are far more female students enrolled in Methodist than male students.
The following table and chart illustrate the changes in student population by gender at Methodist College since 2012.
| Year | Total | Undergraduate | Graduate | ||||
|---|---|---|---|---|---|---|---|
| Total | Men | Women | Total | Men | Women | ||
| 2012-13 | 528 | 528 | 61 | 467 | 0 | 0 | 0 |
| 2013-14 | 508 -20 | 508 -20 | 64 3 | 444 -23 | 0 0 | 0 0 | 0 0 |
| 2014-15 | 595 87 | 595 87 | 77 13 | 518 74 | 0 0 | 0 0 | 0 0 |
| 2015-16 | 606 11 | 603 8 | 76 -1 | 527 9 | 3 3 | 0 0 | 3 3 |
| 2016-17 | 680 74 | 672 69 | 85 9 | 587 60 | 8 5 | 2 2 | 6 3 |
| 2017-18 | 681 1 | 675 3 | 82 -3 | 593 6 | 6 -2 | 0 -2 | 6 0 |
| 2018-19 | 692 11 | 687 12 | 81 -1 | 606 13 | 5 -1 | 0 0 | 5 -1 |
| 2019-20 | 700 8 | 676 -11 | 69 -12 | 607 1 | 24 19 | 1 1 | 23 18 |
| 2020-21 | 595 -105 | 557 -119 | 64 -5 | 493 -114 | 38 14 | 4 3 | 34 11 |
| 2021-22 | 550 -45 | 514 -43 | 58 -6 | 456 -37 | 36 -2 | 2 -2 | 34 0 |
| 2022-23 | 456 -94 | 433 -81 | 40 -18 | 393 -63 | 23 -13 | 1 -1 | 22 -12 |
| Average | 599 | 586 | 69 | 517 | 13 | 1 | 12 |