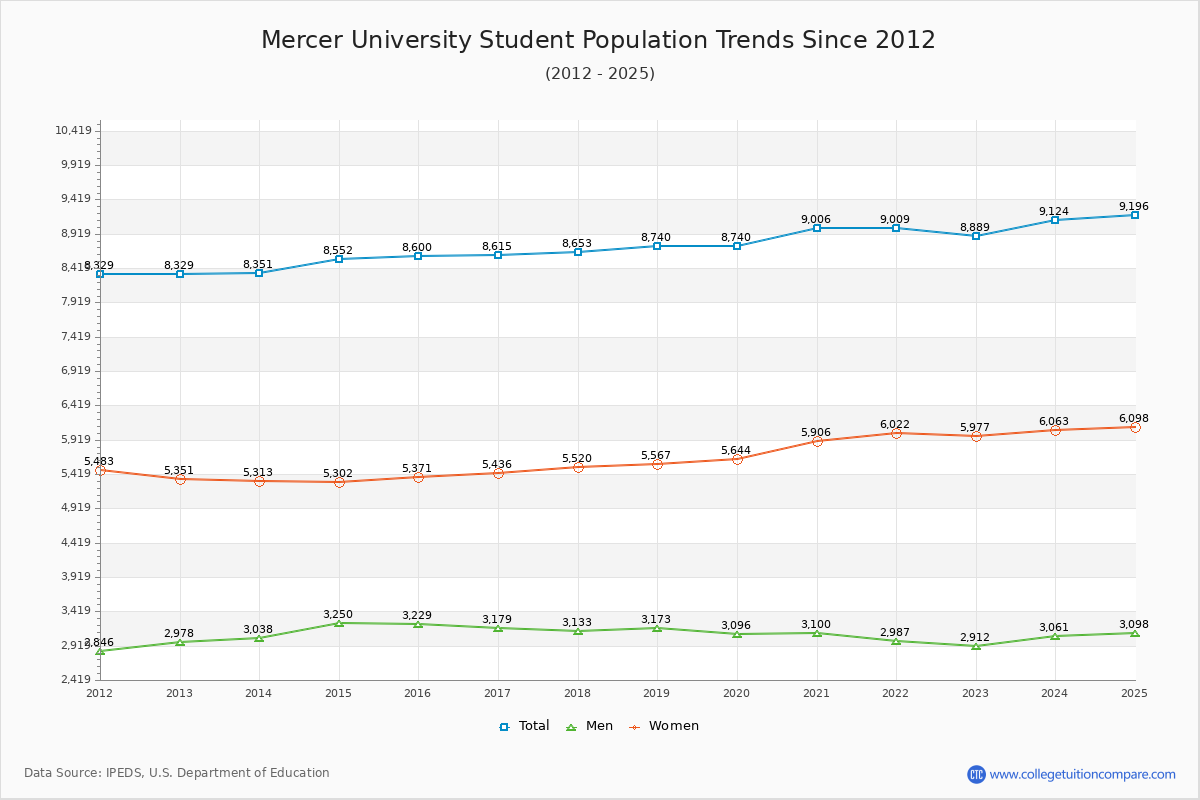
Student Population Changes
The average student population over the last 12 years is 8,680 where 8,889 students are attending the school for the academic year 2022-2023.
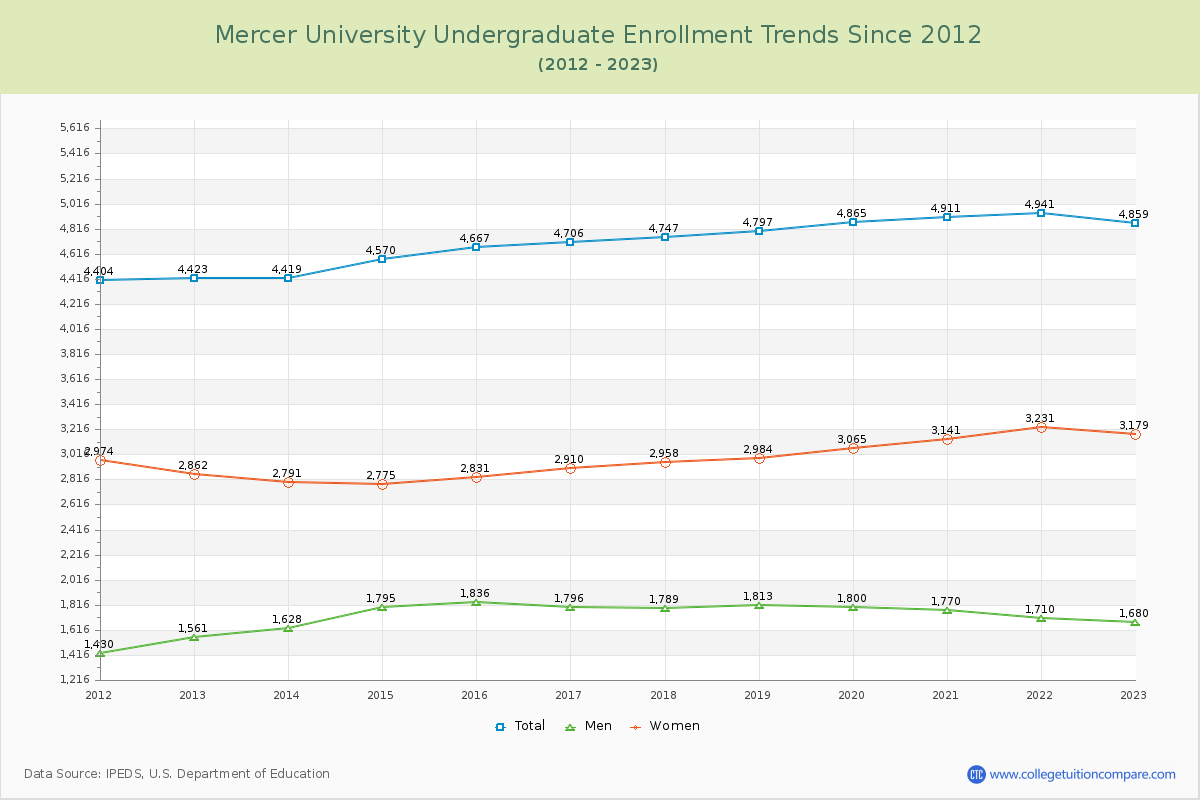
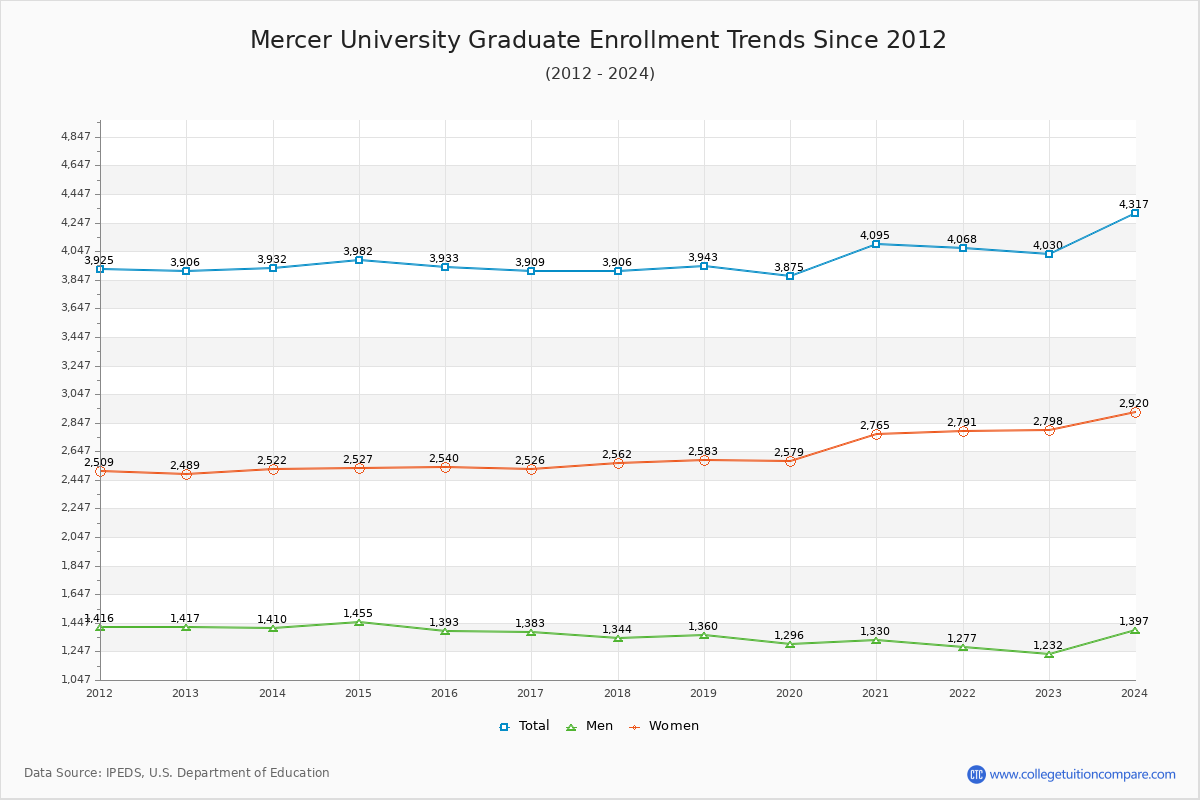
54.66% of total students is undergraduate students and 45.34% students is graduate students. The number of undergraduate students has increased by 436 and the graduate enrollment has increased by 124 over past 10 years.
The female to male ratio is 2.05 to 1 and it means that there are far more female students enrolled in Mercer than male students.
The following table and chart illustrate the changes in student population by gender at Mercer University since 2012.
| Year | Total | Undergraduate | Graduate | ||||
|---|---|---|---|---|---|---|---|
| Total | Men | Women | Total | Men | Women | ||
| 2012-13 | 8,329 | 4,423 | 1,561 | 2,862 | 3,906 | 1,417 | 2,489 |
| 2013-14 | 8,351 22 | 4,419 -4 | 1,628 67 | 2,791 -71 | 3,932 26 | 1,410 -7 | 2,522 33 |
| 2014-15 | 8,552 201 | 4,570 151 | 1,795 167 | 2,775 -16 | 3,982 50 | 1,455 45 | 2,527 5 |
| 2015-16 | 8,600 48 | 4,667 97 | 1,836 41 | 2,831 56 | 3,933 -49 | 1,393 -62 | 2,540 13 |
| 2016-17 | 8,615 15 | 4,706 39 | 1,796 -40 | 2,910 79 | 3,909 -24 | 1,383 -10 | 2,526 -14 |
| 2017-18 | 8,653 38 | 4,747 41 | 1,789 -7 | 2,958 48 | 3,906 -3 | 1,344 -39 | 2,562 36 |
| 2018-19 | 8,740 87 | 4,797 50 | 1,813 24 | 2,984 26 | 3,943 37 | 1,360 16 | 2,583 21 |
| 2019-20 | 8,740 0 | 4,865 68 | 1,800 -13 | 3,065 81 | 3,875 -68 | 1,296 -64 | 2,579 -4 |
| 2020-21 | 9,006 266 | 4,911 46 | 1,770 -30 | 3,141 76 | 4,095 220 | 1,330 34 | 2,765 186 |
| 2021-22 | 9,009 3 | 4,941 30 | 1,710 -60 | 3,231 90 | 4,068 -27 | 1,277 -53 | 2,791 26 |
| 2022-23 | 8,889 -120 | 4,859 -82 | 1,680 -30 | 3,179 -52 | 4,030 -38 | 1,232 -45 | 2,798 7 |
| Average | 8,680 | 4,719 | 1,743 | 2,975 | 3,962 | 1,354 | 2,607 |