Graduation Rate Changes

The average graduation rate of the last 8 years is 76.43% where the current academic year rate is 51%.
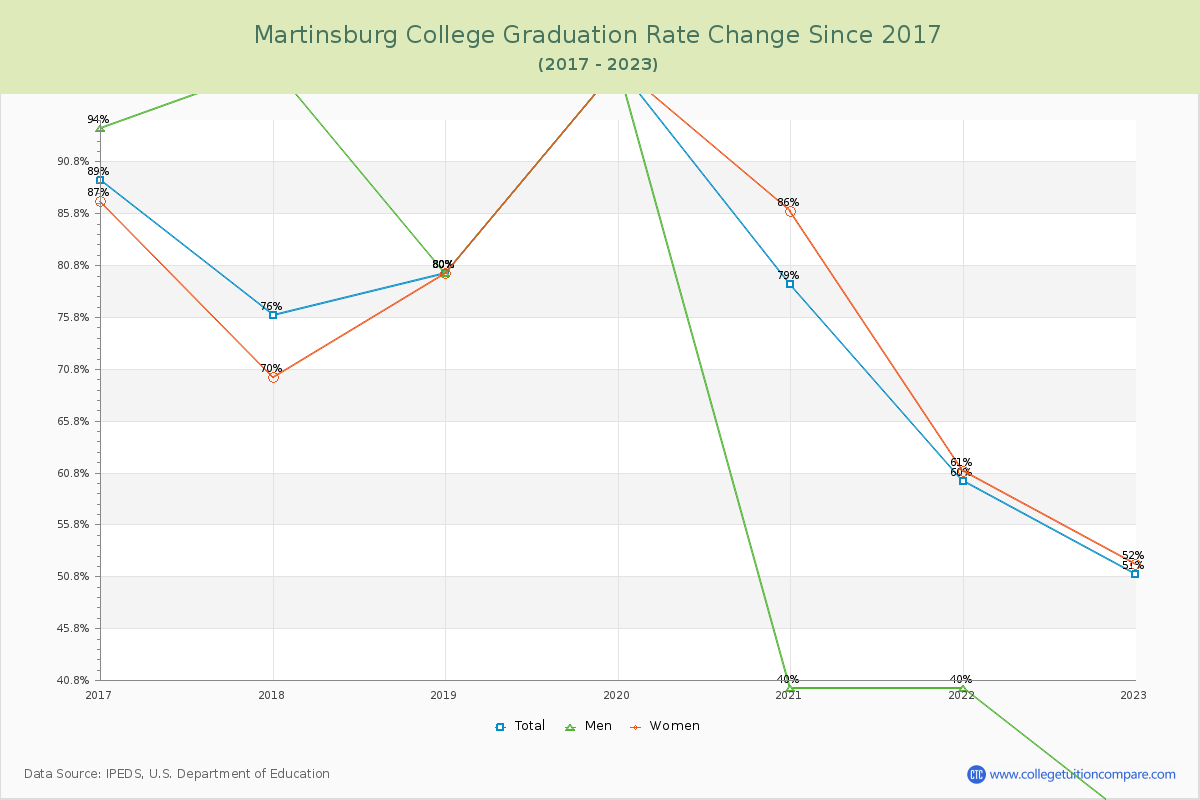
The following table and chart show the changes of graduation rate at Martinsburg College over the past 8 years (2016-2023).
TableInteractive ChartDownloadable Chart
YearTotalMenWomen
2016-17 89%94%87%
2017-18 76%100%70%
2018-19 80%80%80%
2019-20 100%100%100%
2020-21 79%40%86%
2021-22 60%40%61%
2022-23 51%27%52%
Average76.43%68.71%76.57%
Graduation Rate Changes of Martinsburg College
Martinsburg College Graduation Rate Changes Chart

Retention Rate Changes

The average retention rate of the last 8 years is 77.14% for full-time students and 78.43% for part-time students.
The following table shows the changes of retention rate at Martinsburg from 2016 to 2023.
TableChart
YearFull-timePart-time
2016-17100%77%
2017-1891%72%
2018-1967%85%
2019-2095%83%
2020-2166%71%
2021-2260%78%
2022-2361%83%
Average77.14%78.43%
Retention Rate Changes of Martinsburg College

Student to Faculty Ratio Changes

The average student to faculty ratio over the last 8 years is 52.43 to 1 where the current academic year ratio is 56 to 1. The following table and chart illustrate the change of student to faculty ratio at Martinsburg College since 2023.
TableChart
YearStudent to Faculty Ratio
2016-1741:1
2017-1845:1
2018-1949:1
2019-2056:1
2020-2158:1
2021-2262:1
2022-2356:1
Average52.43:1
Student to Faculty Ratio Changes of Martinsburg College
Related Articles and Ads