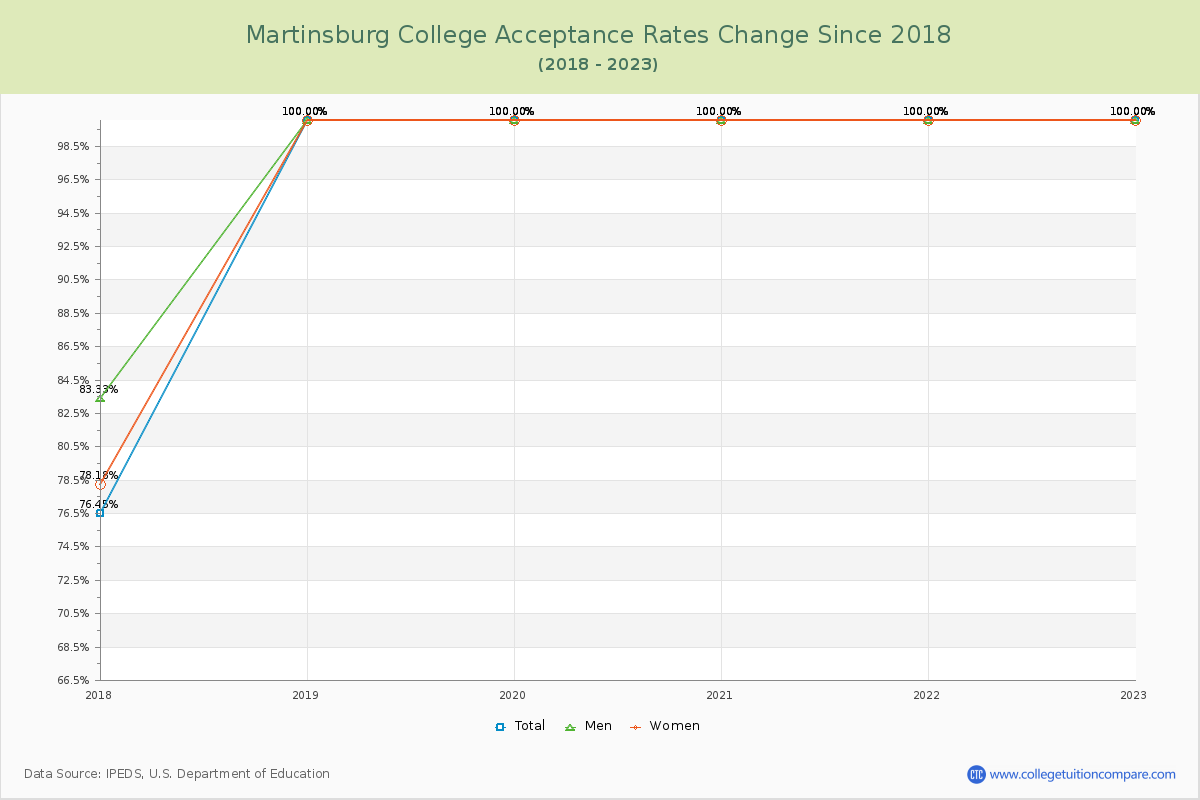
Acceptance Rate Changes
The average acceptance rate over the last 10 years is 96.08%, and this year's acceptance rate is 100.00% at Martinsburg College. By gender, men students' acceptance rate is 97.22% and women students' rate is 96.36%.
The next table and chart illustrate the acceptance rates changes at Martinsburg College over the past 6 years (2017-2023).
| Year | Total | Men | Women |
|---|---|---|---|
| 2017-18 | 76.45% | 83.33% | 78.18% |
| 2018-19 | 100.00% 23.55% |
100.00% 21.82% |
100.00% 21.82% |
| 2019-20 | 100.00% 0.00% |
100.00% 0.00% |
100.00% 0.00% |
| 2020-21 | 100.00% 0.00% |
100.00% 0.00% |
100.00% 0.00% |
| 2021-22 | 100.00% 0.00% |
100.00% 0.00% |
100.00% 0.00% |
| 2022-23 | 100.00% 0.00% |
100.00% 0.00% |
100.00% 0.00% |
| Average | 96.08% | 97.22% | 96.36% |