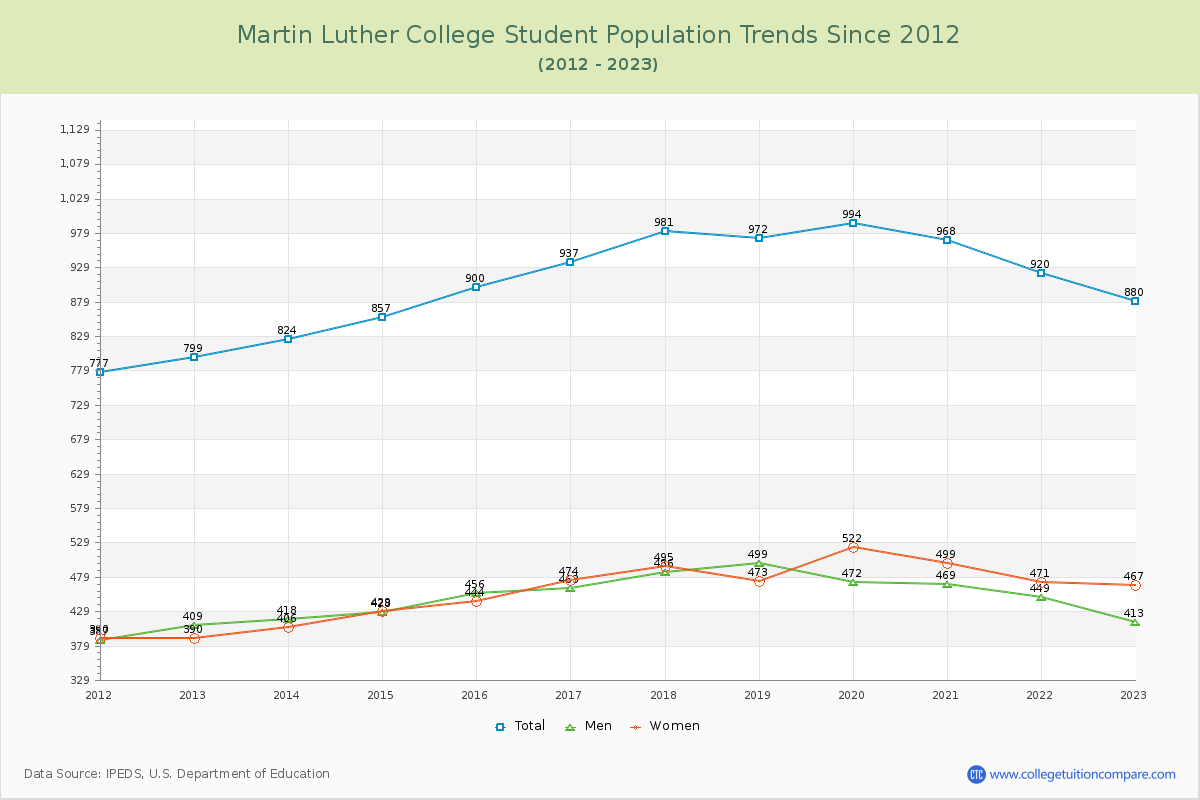
Student Population Changes
The average student population over the last 12 years is 912 where 880 students are attending the school for the academic year 2022-2023.
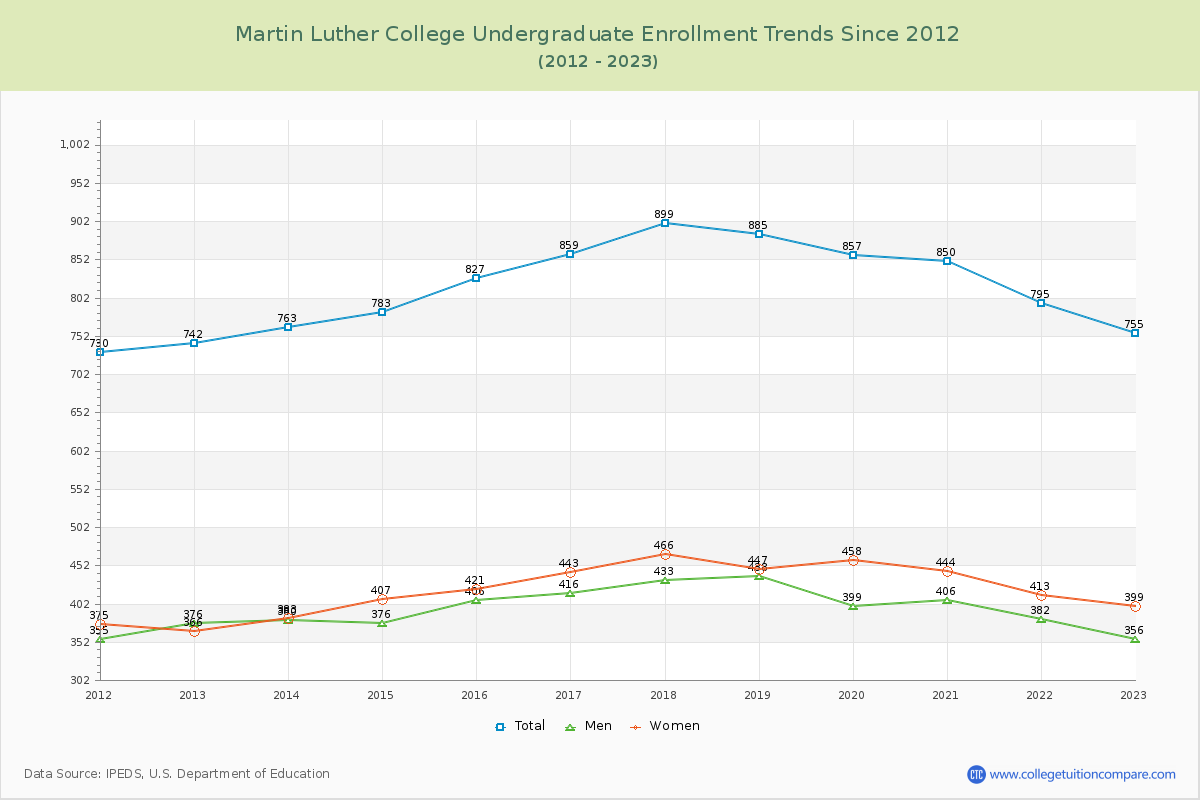
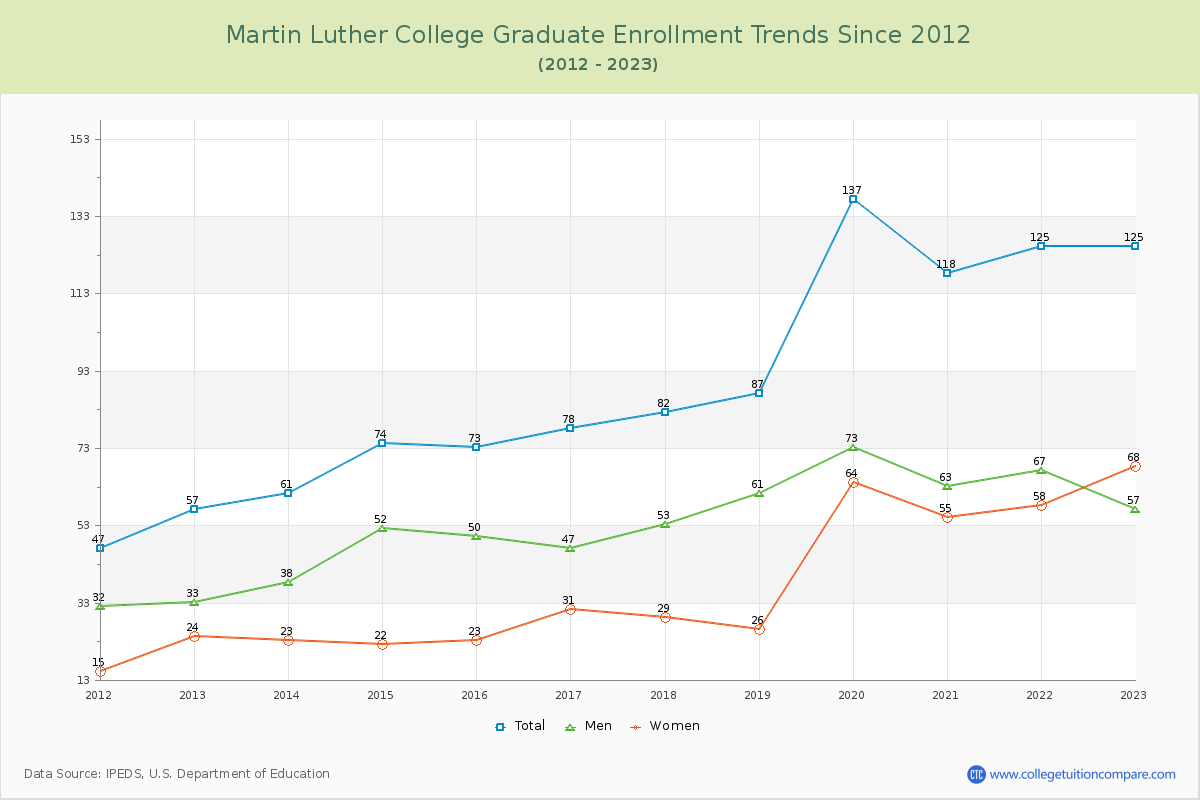
85.80% of total students is undergraduate students and 14.20% students is graduate students. The number of undergraduate students has increased by 13 and the graduate enrollment has increased by 68 over past 10 years.
The female to male ratio is 1.13 to 1 and it means that there are slightly more female students enrolled in MLC than male students.
The following table and chart illustrate the changes in student population by gender at Martin Luther College since 2012.
| Year | Total | Undergraduate | Graduate | ||||
|---|---|---|---|---|---|---|---|
| Total | Men | Women | Total | Men | Women | ||
| 2012-13 | 799 | 742 | 376 | 366 | 57 | 33 | 24 |
| 2013-14 | 824 25 | 763 21 | 380 4 | 383 17 | 61 4 | 38 5 | 23 -1 |
| 2014-15 | 857 33 | 783 20 | 376 -4 | 407 24 | 74 13 | 52 14 | 22 -1 |
| 2015-16 | 900 43 | 827 44 | 406 30 | 421 14 | 73 -1 | 50 -2 | 23 1 |
| 2016-17 | 937 37 | 859 32 | 416 10 | 443 22 | 78 5 | 47 -3 | 31 8 |
| 2017-18 | 981 44 | 899 40 | 433 17 | 466 23 | 82 4 | 53 6 | 29 -2 |
| 2018-19 | 972 -9 | 885 -14 | 438 5 | 447 -19 | 87 5 | 61 8 | 26 -3 |
| 2019-20 | 994 22 | 857 -28 | 399 -39 | 458 11 | 137 50 | 73 12 | 64 38 |
| 2020-21 | 968 -26 | 850 -7 | 406 7 | 444 -14 | 118 -19 | 63 -10 | 55 -9 |
| 2021-22 | 920 -48 | 795 -55 | 382 -24 | 413 -31 | 125 7 | 67 4 | 58 3 |
| 2022-23 | 880 -40 | 755 -40 | 356 -26 | 399 -14 | 125 0 | 57 -10 | 68 10 |
| Average | 912 | 820 | 397 | 422 | 92 | 54 | 38 |