Enrollment Trends at Marian

-853

Total Enrollment

-178

Men

-675

Women

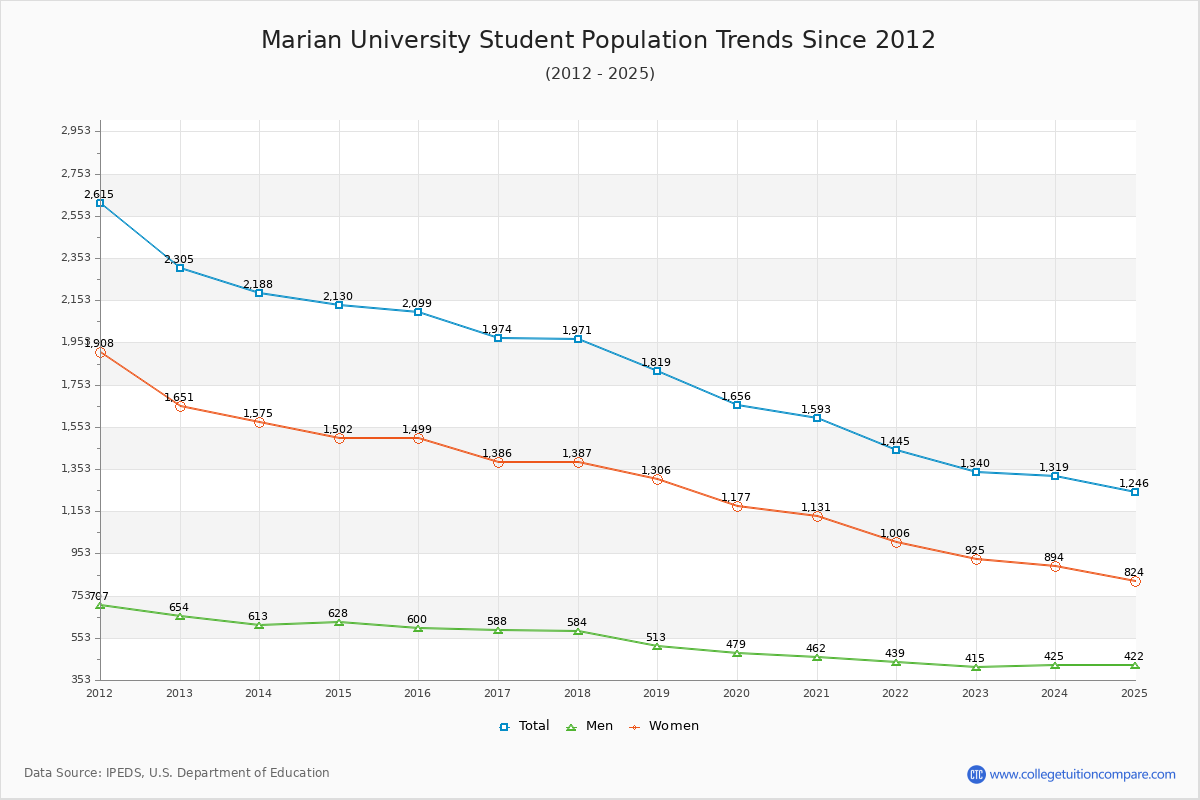
The student population at Marian University is 1,246 (1,021 undergraduate and 225 graduate students) . The number of students has decreased by 853 over the past decade.

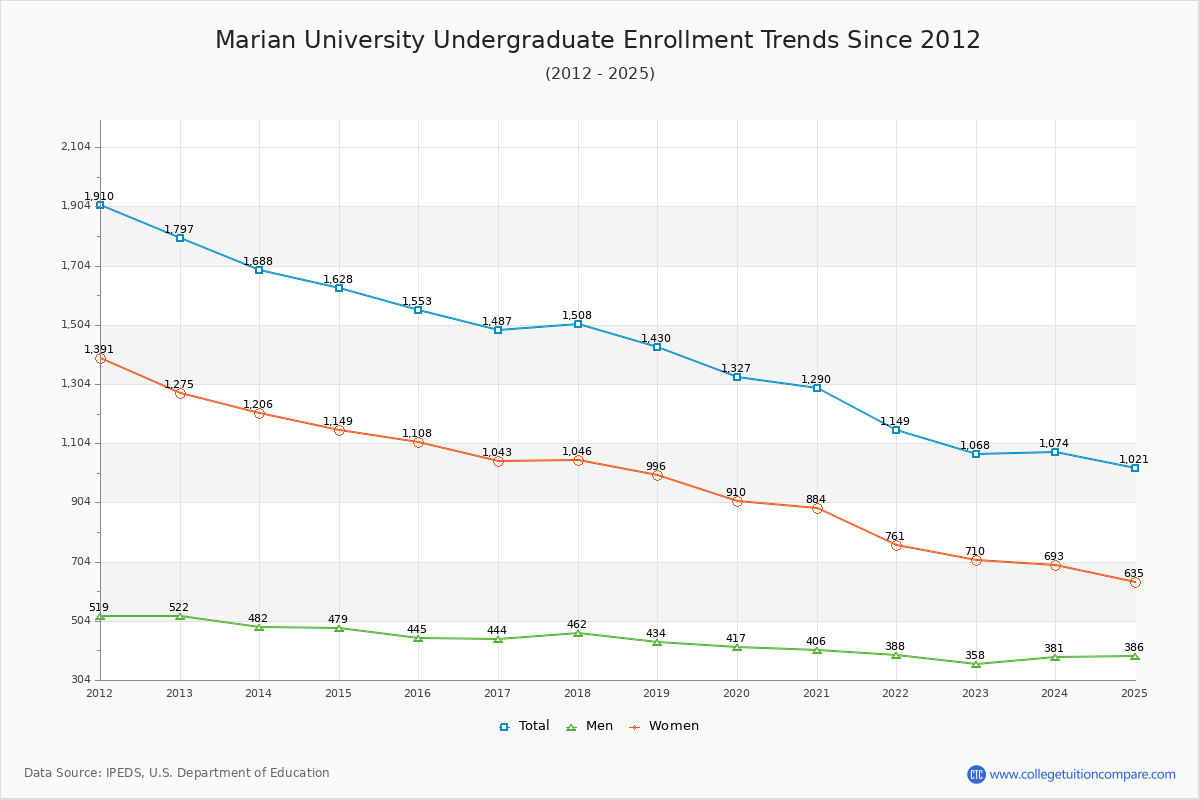
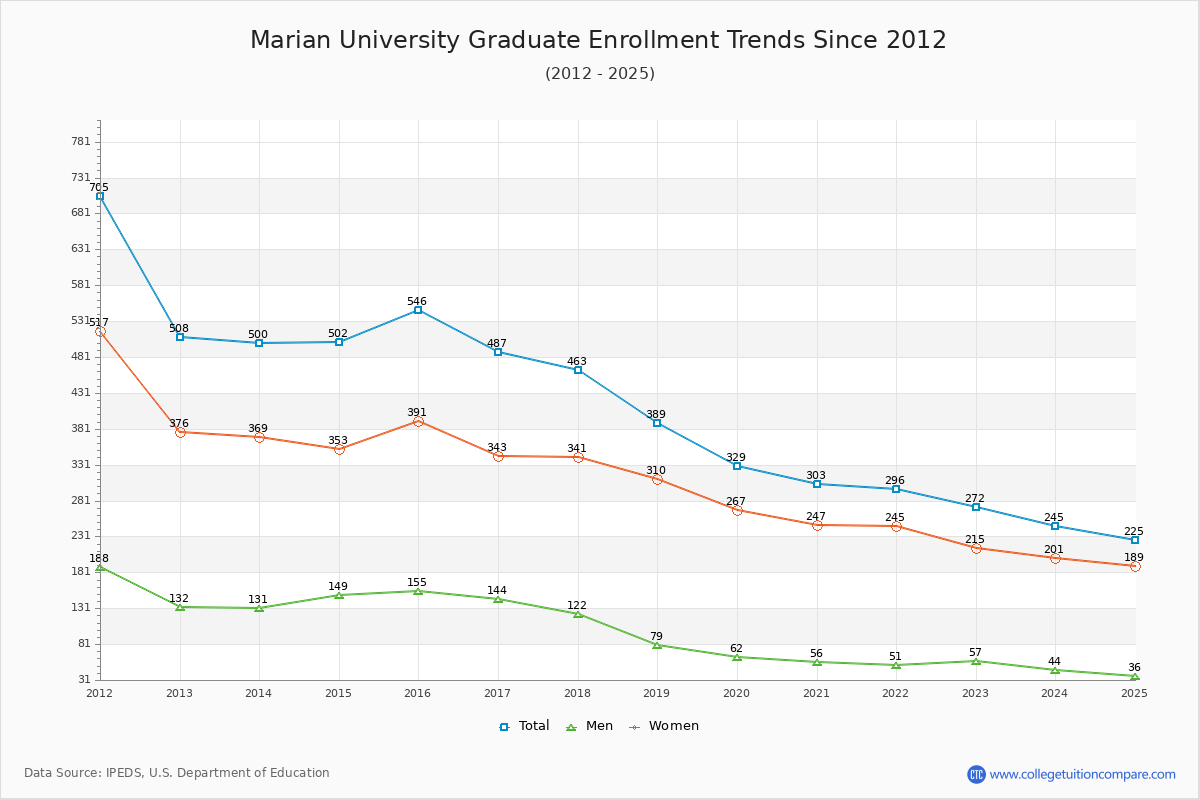
The percentage of undergraduate students at Marian is 81.94% which is decreased by 532 over last 10 years. The graduate student population decreased by 321 and it has been decreasing.

The female to male ratio is 1.95 to 1 which means that female students enrolled more than male students.

372 students enrolled in online degree program exclusively and the number of online students has decreased by -6.53% since 2015.

Student Population Changes

The average student population over the last 11 years is 1,646 where 1,246 students are attending the school for the academic year 2024-2025.

81.94% of total students is undergraduate students and 18.06% students is graduate students. The number of undergraduate students has decreased by 532 and the graduate enrollment has decreased by 321 over past 10 years.

The female to male ratio is 1.95 to 1 and it means that there are more female students enrolled in Marian than male students.

The following table and chart illustrate the changes in student population by gender at Marian University since 2015.

YearTotalUndergraduateGraduate
TotalMenWomenTotalMenWomen
2015-162,0991,5534451,108546155391
2016-171,974
-125
1,487
-66
444
-1
1,043
-65
487
-59
144
-11
343
-48
2017-181,971
-3
1,508
21
462
18
1,046
3
463
-24
122
-22
341
-2
2018-191,819
-152
1,430
-78
434
-28
996
-50
389
-74
79
-43
310
-31
2019-201,656
-163
1,327
-103
417
-17
910
-86
329
-60
62
-17
267
-43
2020-211,593
-63
1,290
-37
406
-11
884
-26
303
-26
56
-6
247
-20
2021-221,445
-148
1,149
-141
388
-18
761
-123
296
-7
51
-5
245
-2
2022-231,340
-105
1,068
-81
358
-30
710
-51
272
-24
57
6
215
-30
2023-241,319
-21
1,074
6
381
23
693
-17
245
-27
44
-13
201
-14
2024-251,246
-73
1,021
-53
386
5
635
-58
225
-20
36
-8
189
-12
Average1,6461,29141287935681275
Marian University Enrollment Trends Chart

Undergraduate Enrollment Changes

The average number of Undergraduate students over the last 11 years is 1,291 where 1,021 students are attending the Undergraduate school for the academic year 2024-2025. The following table and chart illustrate the changes in Undergraduate enrollment by attending status and gender at Marian University since 2015.

YearTotalFull-timePart-time
TotalMenWomenTotalMenWomen
2015-161,5531,28737691126669197
2016-171,4871,18436881630376227
2017-181,5081,25439785725465189
2018-191,4301,21839182721243169
2019-201,3271,17137979215638118
2020-211,2901,11936575417141130
2021-221,14999334964415639117
2022-231,06892032459614834114
2023-241,07491434157316040120
2024-251,02179232446822962167
Average1,2911,2913617241,29151155
Marian University Undergraduate Enrollment Trends Chart

Graduate Enrollment Changes

The average number of Graduate students over the last 11 years is 356 where 225 students are attending the Graduate school for the academic year 2024-2025. The following table and chart illustrate the changes in Graduate enrollment by attending status and gender at Marian University since 2015.

YearTotalFull-timePart-time
TotalMenWomenTotalMenWomen
2015-1654644638502149353
2016-1748727423460140320
2017-1846326620437116321
2018-193892762136273289
2019-203292642230358245
2020-213031381712116539126
2021-222963342926347216
2022-232722021825255197
2023-242453012921543172
2024-2522541103118426158
Average35635663535675240
Marian University Graduate Enrollment Trends Chart

Enrollment by Race/Ethnicity Changes

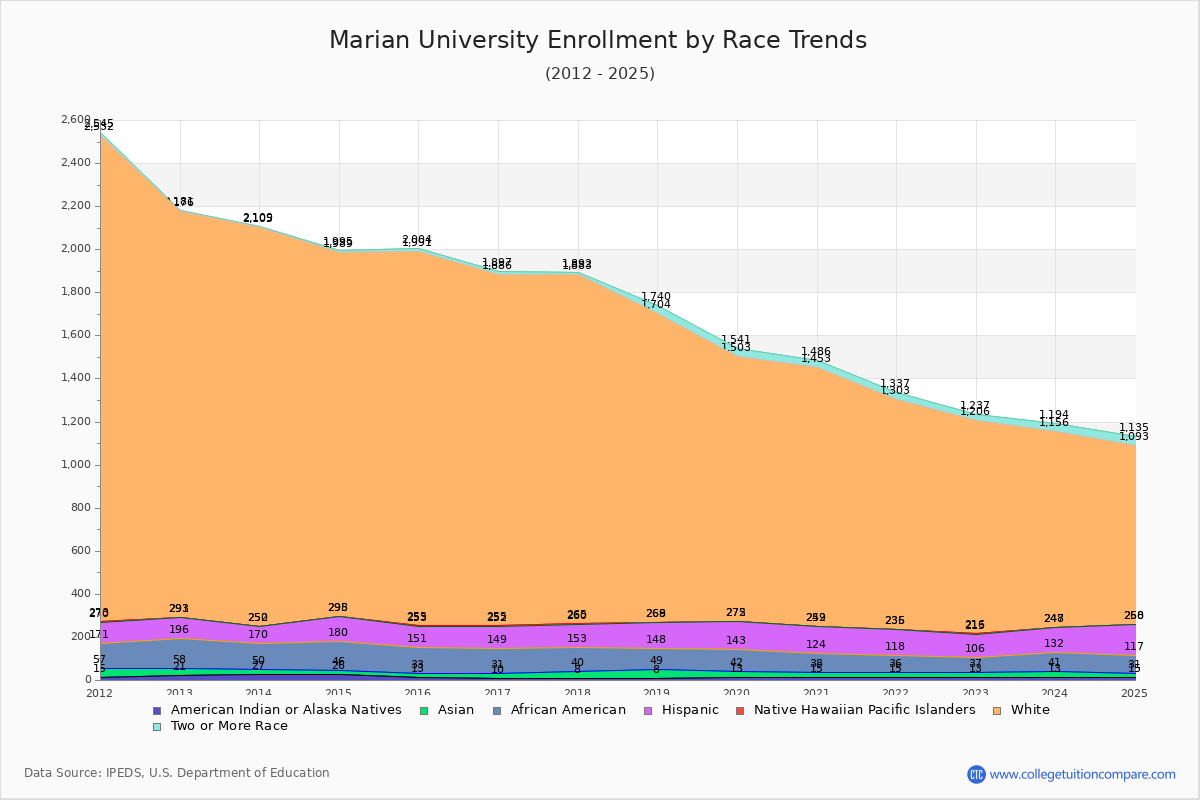
The percentage of white students is 66.85%. The percentage was 82.71% 10 years ago and Marian still has a high percentage of white students. 1.28% of enrolled students is Asian and 6.90% is black students. Hispanic students comprise 11.32% of the student body.

Over the past 10 years, the racial composition has shifted. The percentage of white students decreased from 82.71% to 66.85%. Asian enrollment grew from 0.95% to 1.28%. Black student enrollment increased from 5.62% to 6.90%. Hispanic student representation expanded from 4.86% to 11.32%.

The overall racial diversity, measured by the Census Bureau Diversity Index, is 0.5340 which indicates that somewhat diverse. This increased from 0.3103 a decade ago, suggesting that racial diversity has improved.

The following table and chart illustrate the student population trends by race/ethnicity at Marian University over the past 11 years (2015-2025).

YearAmerican Indian or Native AmericanAsianBlackHispanicNative Hawaiian or Other Pacific IslanderWhiteTwo or More Races
2015-16132011810221,73613
2016-17102111810331,63111
2017-1883211310751,6189
2018-198419912011,43536
2019-20132910112931,22838
2020-2115238612531,20133
2021-2215218211711,06734
2022-23132469109199031
2023-24132891115190838
2024-25151686141283342
Average12269611721,26529
Marian University Enrollment by Race Trends Chart

Distance Learning (Online Courses) Enrollment Changes

372 students are enrolled in online degree programs exclusively for the academic year 2024-2025, which is 30% of total students. The number of online students has decreased -6.53% since 2015. The following table and chart illustrate the changes in the online student population by enrolled type at Marian University from 2015 to 2025.

YearTotal EnrollmentOnline CompletelyEnrolled in Some Online CoursesNot Enrolled in Online Courses
2015-162,0993984761,225
2016-171,9743893921,193
2017-181,9713624131,196
2018-191,8193132731,233
2019-201,6562691531,234
2020-211,5934081611,024
2021-221,44540197947
2022-231,34039698846
2023-241,319391204724
2024-251,246372182692
Average1,6463702451,031

Ratings & Review

Share your experiences and thoughts about Marian University. It will be a great help to applicants and prospective students!