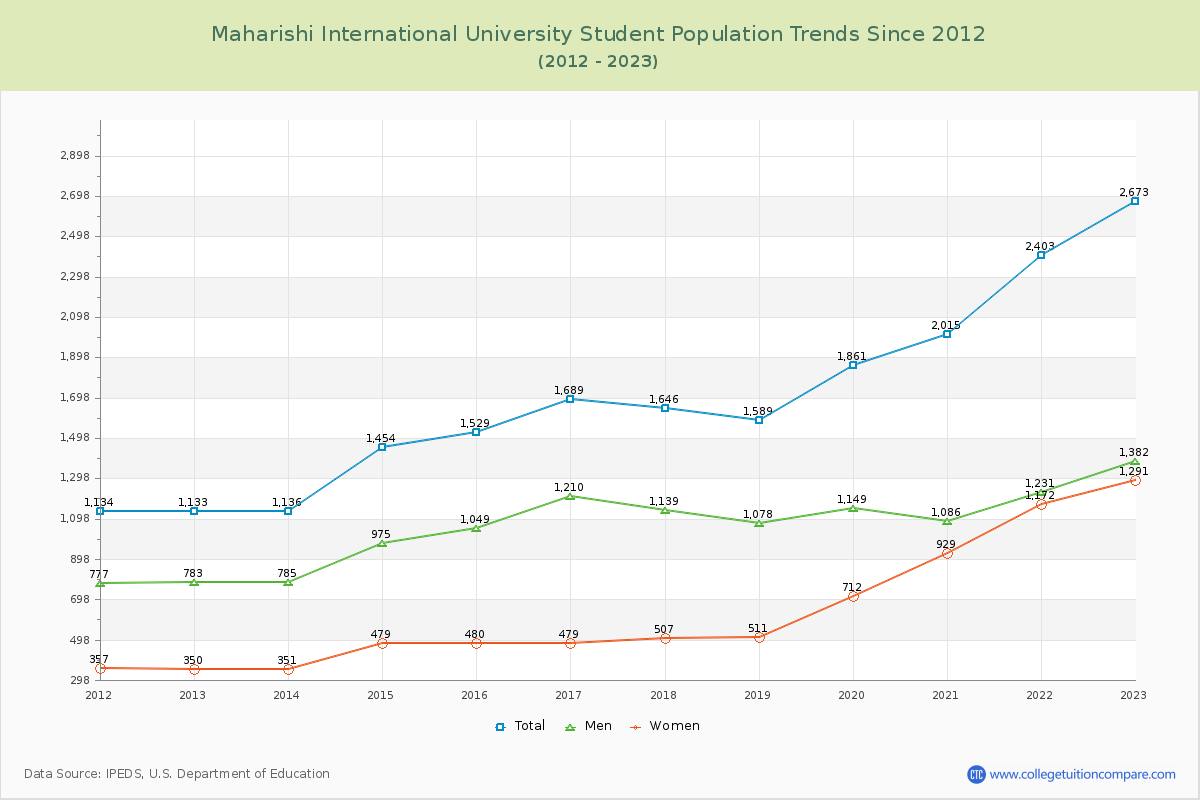
Student Population Changes
The average student population over the last 12 years is 1,739 where 2,673 students are attending the school for the academic year 2022-2023.
25.48% of total students is undergraduate students and 74.52% students is graduate students. The number of undergraduate students has increased by 325 and the graduate enrollment has increased by 1,215 over past 10 years.
The female to male ratio is 0.93 to 1 and it means that there are similar numbers of female and male students enrolled in Maharishi International.
The following table and chart illustrate the changes in student population by gender at Maharishi International University since 2012.
| Year | Total | Undergraduate | Graduate | ||||
|---|---|---|---|---|---|---|---|
| Total | Men | Women | Total | Men | Women | ||
| 2012-13 | 1,133 | 356 | 193 | 163 | 777 | 590 | 187 |
| 2013-14 | 1,136 3 | 319 -37 | 172 -21 | 147 -16 | 817 40 | 613 23 | 204 17 |
| 2014-15 | 1,454 318 | 402 83 | 209 37 | 193 46 | 1,052 235 | 766 153 | 286 82 |
| 2015-16 | 1,529 75 | 353 -49 | 174 -35 | 179 -14 | 1,176 124 | 875 109 | 301 15 |
| 2016-17 | 1,689 160 | 337 -16 | 157 -17 | 180 1 | 1,352 176 | 1,053 178 | 299 -2 |
| 2017-18 | 1,646 -43 | 324 -13 | 134 -23 | 190 10 | 1,322 -30 | 1,005 -48 | 317 18 |
| 2018-19 | 1,589 -57 | 324 0 | 120 -14 | 204 14 | 1,265 -57 | 958 -47 | 307 -10 |
| 2019-20 | 1,861 272 | 457 133 | 135 15 | 322 118 | 1,404 139 | 1,014 56 | 390 83 |
| 2020-21 | 2,015 154 | 541 84 | 134 -1 | 407 85 | 1,474 70 | 952 -62 | 522 132 |
| 2021-22 | 2,403 388 | 655 114 | 153 19 | 502 95 | 1,748 274 | 1,078 126 | 670 148 |
| 2022-23 | 2,673 270 | 681 26 | 162 9 | 519 17 | 1,992 244 | 1,220 142 | 772 102 |
| Average | 1,739 | 432 | 158 | 273 | 1,307 | 920 | 387 |