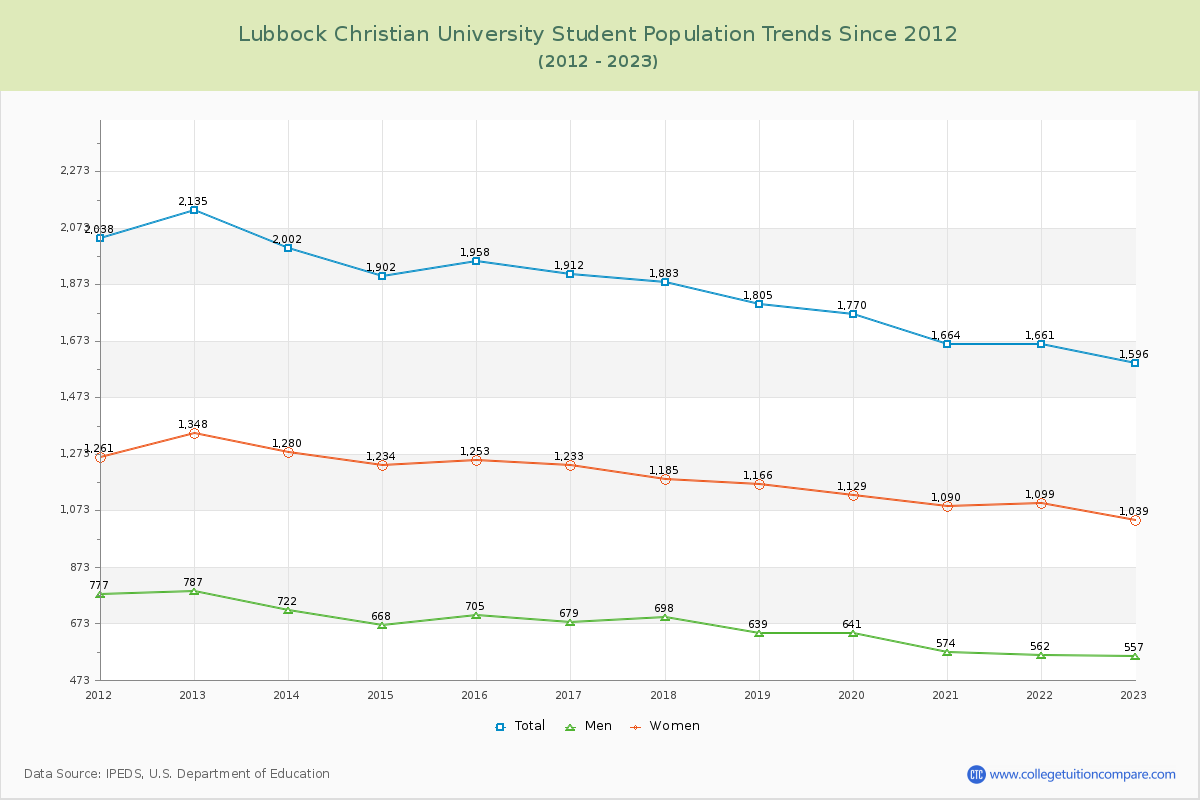
Student Population Changes
The average student population over the last 12 years is 1,844 where 1,596 students are attending the school for the academic year 2022-2023.
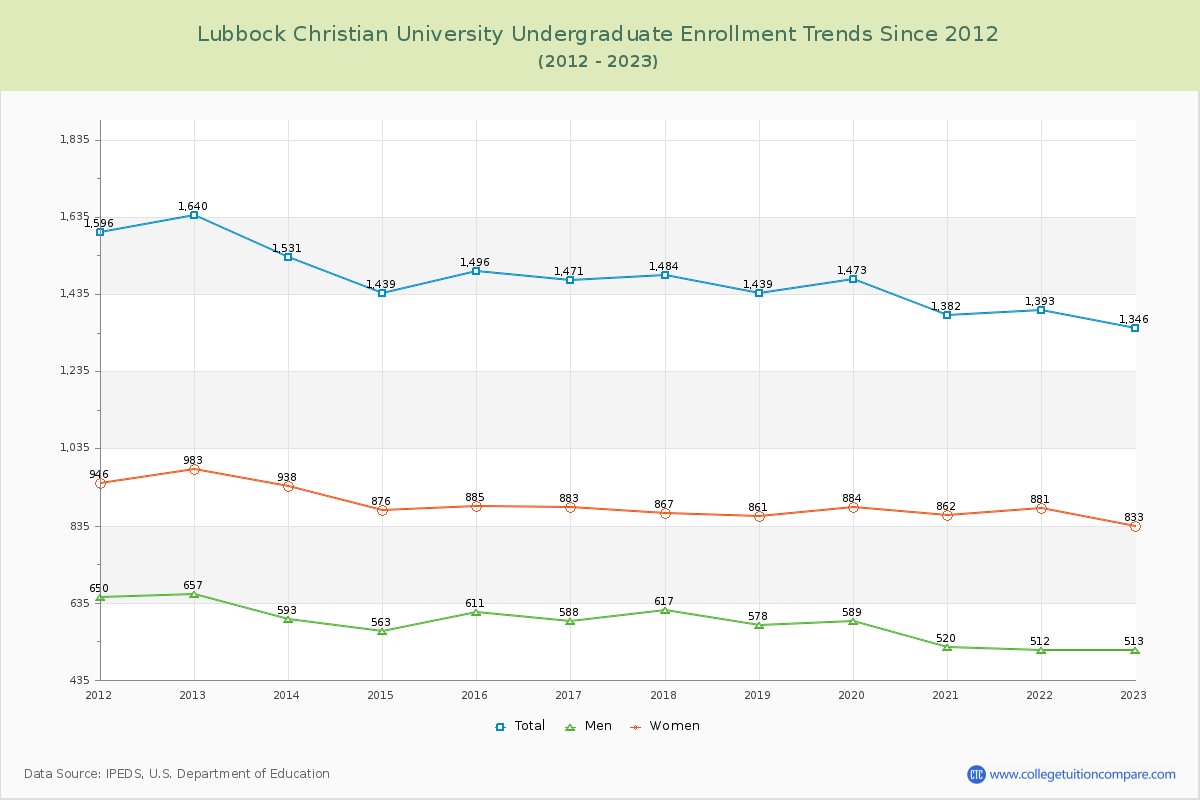
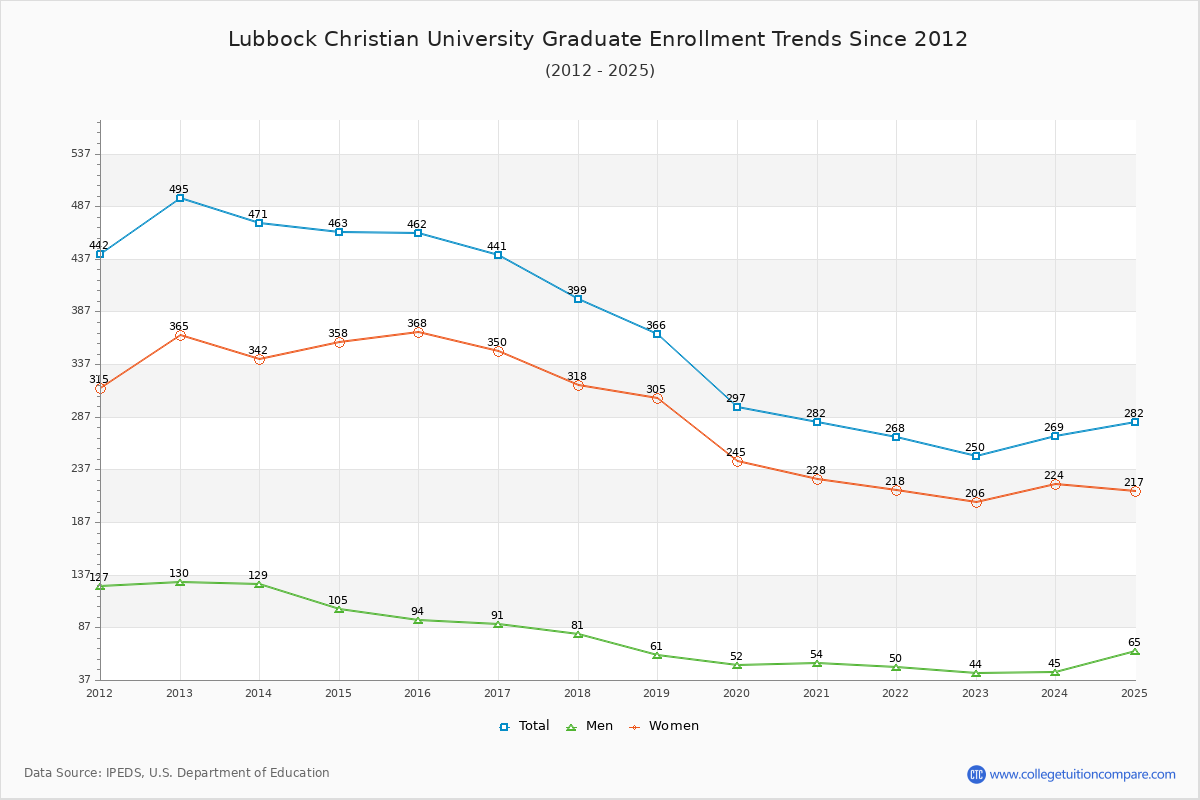
84.34% of total students is undergraduate students and 15.66% students is graduate students. The number of undergraduate students has decreased by 294 and the graduate enrollment has decreased by 245 over past 10 years.
The female to male ratio is 1.87 to 1 and it means that there are more female students enrolled in LCU than male students.
The following table and chart illustrate the changes in student population by gender at Lubbock Christian University since 2012.
| Year | Total | Undergraduate | Graduate | ||||
|---|---|---|---|---|---|---|---|
| Total | Men | Women | Total | Men | Women | ||
| 2012-13 | 2,135 | 1,640 | 657 | 983 | 495 | 130 | 365 |
| 2013-14 | 2,002 -133 | 1,531 -109 | 593 -64 | 938 -45 | 471 -24 | 129 -1 | 342 -23 |
| 2014-15 | 1,902 -100 | 1,439 -92 | 563 -30 | 876 -62 | 463 -8 | 105 -24 | 358 16 |
| 2015-16 | 1,958 56 | 1,496 57 | 611 48 | 885 9 | 462 -1 | 94 -11 | 368 10 |
| 2016-17 | 1,912 -46 | 1,471 -25 | 588 -23 | 883 -2 | 441 -21 | 91 -3 | 350 -18 |
| 2017-18 | 1,883 -29 | 1,484 13 | 617 29 | 867 -16 | 399 -42 | 81 -10 | 318 -32 |
| 2018-19 | 1,805 -78 | 1,439 -45 | 578 -39 | 861 -6 | 366 -33 | 61 -20 | 305 -13 |
| 2019-20 | 1,770 -35 | 1,473 34 | 589 11 | 884 23 | 297 -69 | 52 -9 | 245 -60 |
| 2020-21 | 1,664 -106 | 1,382 -91 | 520 -69 | 862 -22 | 282 -15 | 54 2 | 228 -17 |
| 2021-22 | 1,661 -3 | 1,393 11 | 512 -8 | 881 19 | 268 -14 | 50 -4 | 218 -10 |
| 2022-23 | 1,596 -65 | 1,346 -47 | 513 1 | 833 -48 | 250 -18 | 44 -6 | 206 -12 |
| Average | 1,844 | 1,463 | 576 | 887 | 381 | 81 | 300 |