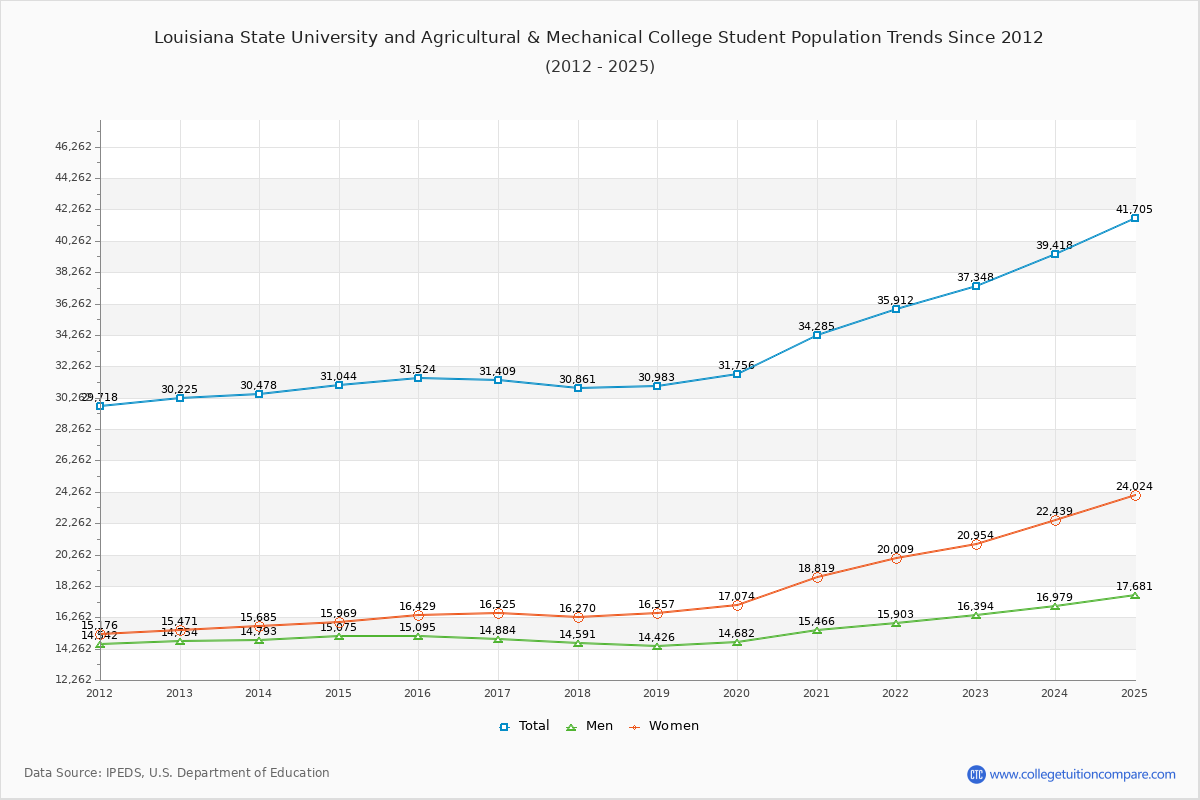
Student Population Changes
The average student population over the last 12 years is 32,348 where 37,348 students are attending the school for the academic year 2022-2023.
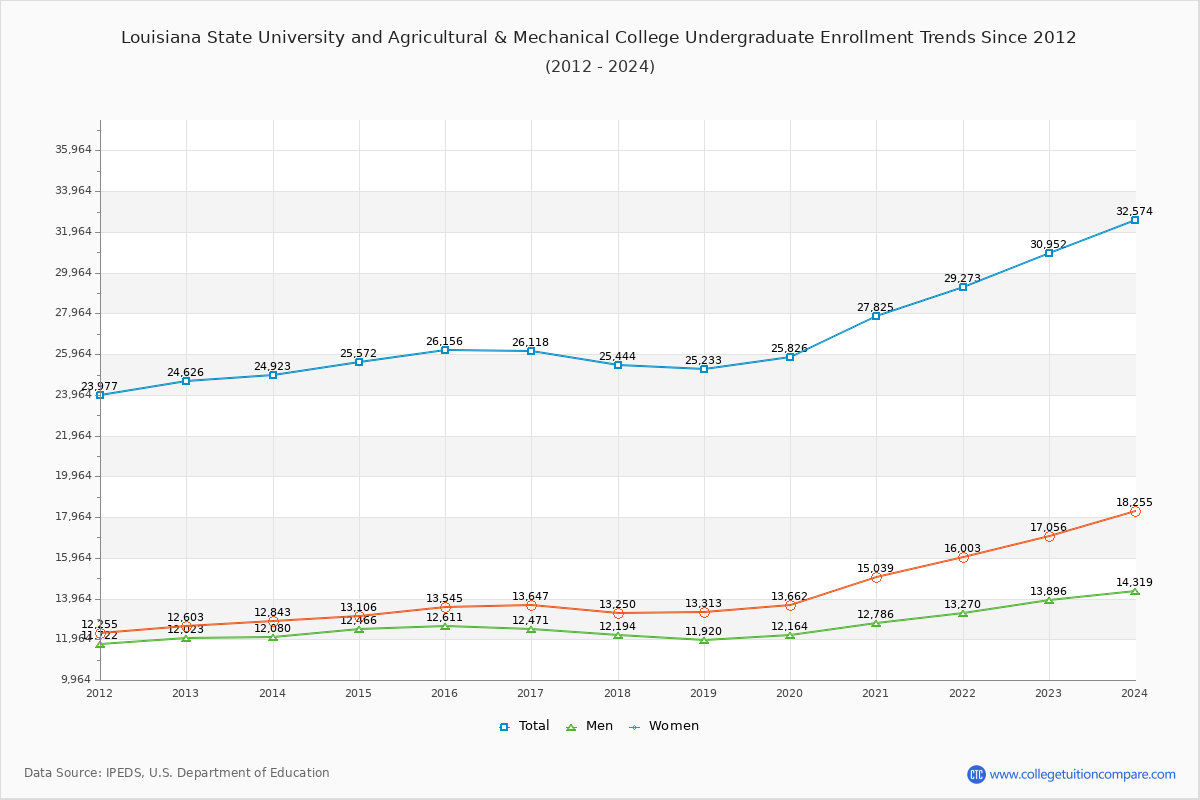
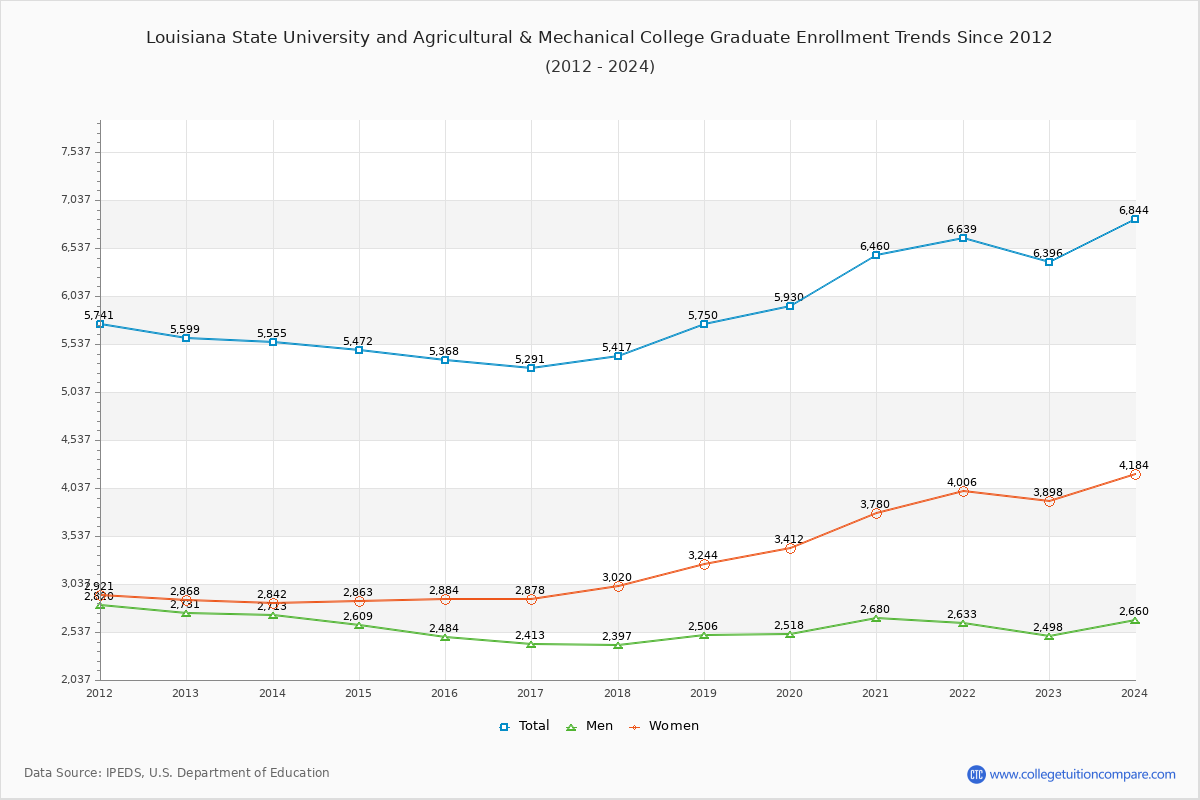
82.87% of total students is undergraduate students and 17.13% students is graduate students. The number of undergraduate students has increased by 6,326 and the graduate enrollment has increased by 797 over past 10 years.
The female to male ratio is 1.28 to 1 and it means that there are slightly more female students enrolled in LSU than male students.
The following table and chart illustrate the changes in student population by gender at Louisiana State University and Agricultural & Mechanical College since 2012.
| Year | Total | Undergraduate | Graduate | ||||
|---|---|---|---|---|---|---|---|
| Total | Men | Women | Total | Men | Women | ||
| 2012-13 | 30,225 | 24,626 | 12,023 | 12,603 | 5,599 | 2,731 | 2,868 |
| 2013-14 | 30,478 253 | 24,923 297 | 12,080 57 | 12,843 240 | 5,555 -44 | 2,713 -18 | 2,842 -26 |
| 2014-15 | 31,044 566 | 25,572 649 | 12,466 386 | 13,106 263 | 5,472 -83 | 2,609 -104 | 2,863 21 |
| 2015-16 | 31,524 480 | 26,156 584 | 12,611 145 | 13,545 439 | 5,368 -104 | 2,484 -125 | 2,884 21 |
| 2016-17 | 31,409 -115 | 26,118 -38 | 12,471 -140 | 13,647 102 | 5,291 -77 | 2,413 -71 | 2,878 -6 |
| 2017-18 | 30,861 -548 | 25,444 -674 | 12,194 -277 | 13,250 -397 | 5,417 126 | 2,397 -16 | 3,020 142 |
| 2018-19 | 30,983 122 | 25,233 -211 | 11,920 -274 | 13,313 63 | 5,750 333 | 2,506 109 | 3,244 224 |
| 2019-20 | 31,756 773 | 25,826 593 | 12,164 244 | 13,662 349 | 5,930 180 | 2,518 12 | 3,412 168 |
| 2020-21 | 34,285 2,529 | 27,825 1,999 | 12,786 622 | 15,039 1,377 | 6,460 530 | 2,680 162 | 3,780 368 |
| 2021-22 | 35,912 1,627 | 29,273 1,448 | 13,270 484 | 16,003 964 | 6,639 179 | 2,633 -47 | 4,006 226 |
| 2022-23 | 37,348 1,436 | 30,952 1,679 | 13,896 626 | 17,056 1,053 | 6,396 -243 | 2,498 -135 | 3,898 -108 |
| Average | 32,348 | 26,541 | 12,535 | 14,006 | 5,807 | 2,562 | 3,245 |