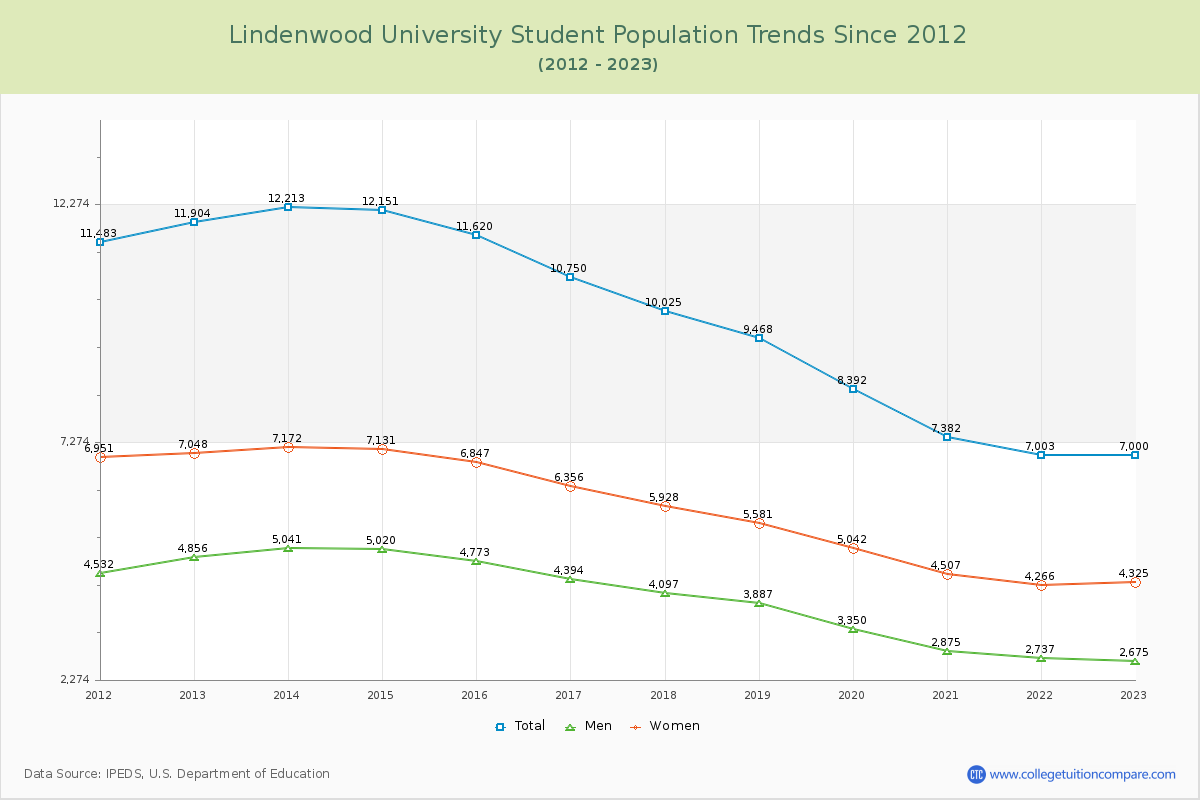
Student Population Changes
The average student population over the last 12 years is 9,810 where 7,000 students are attending the school for the academic year 2022-2023.
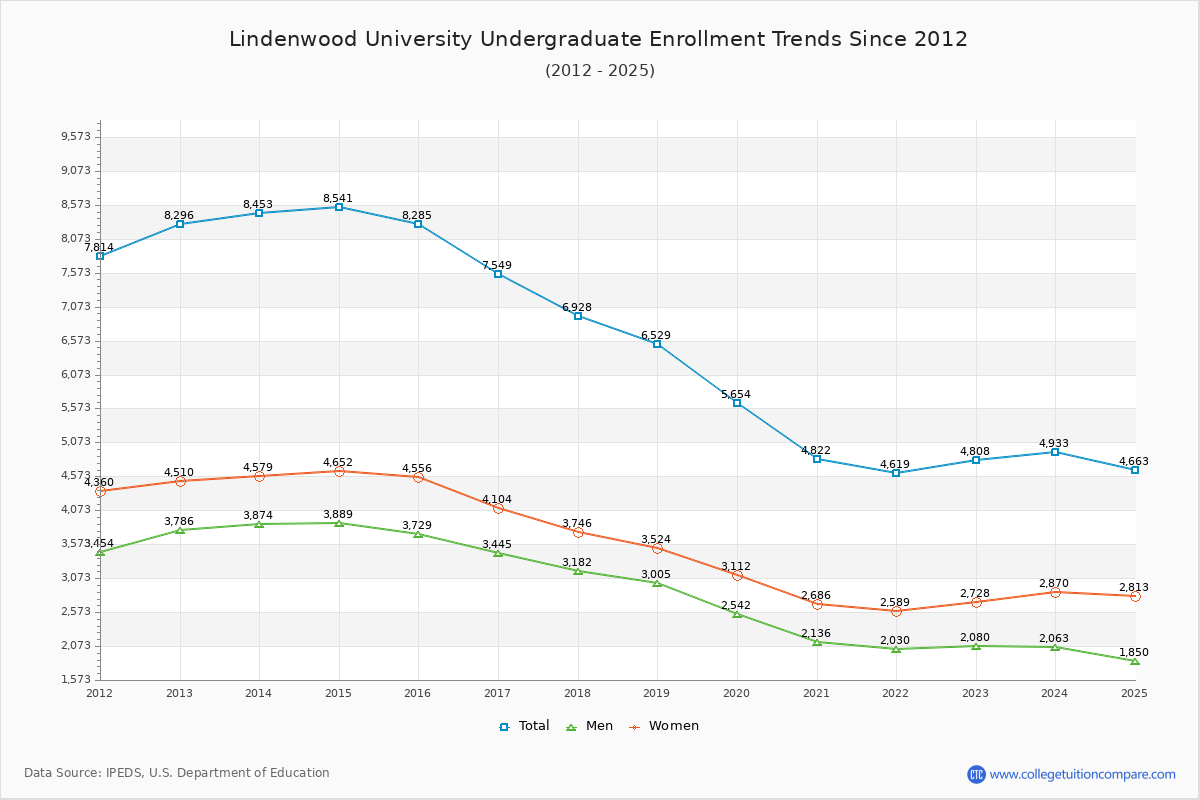
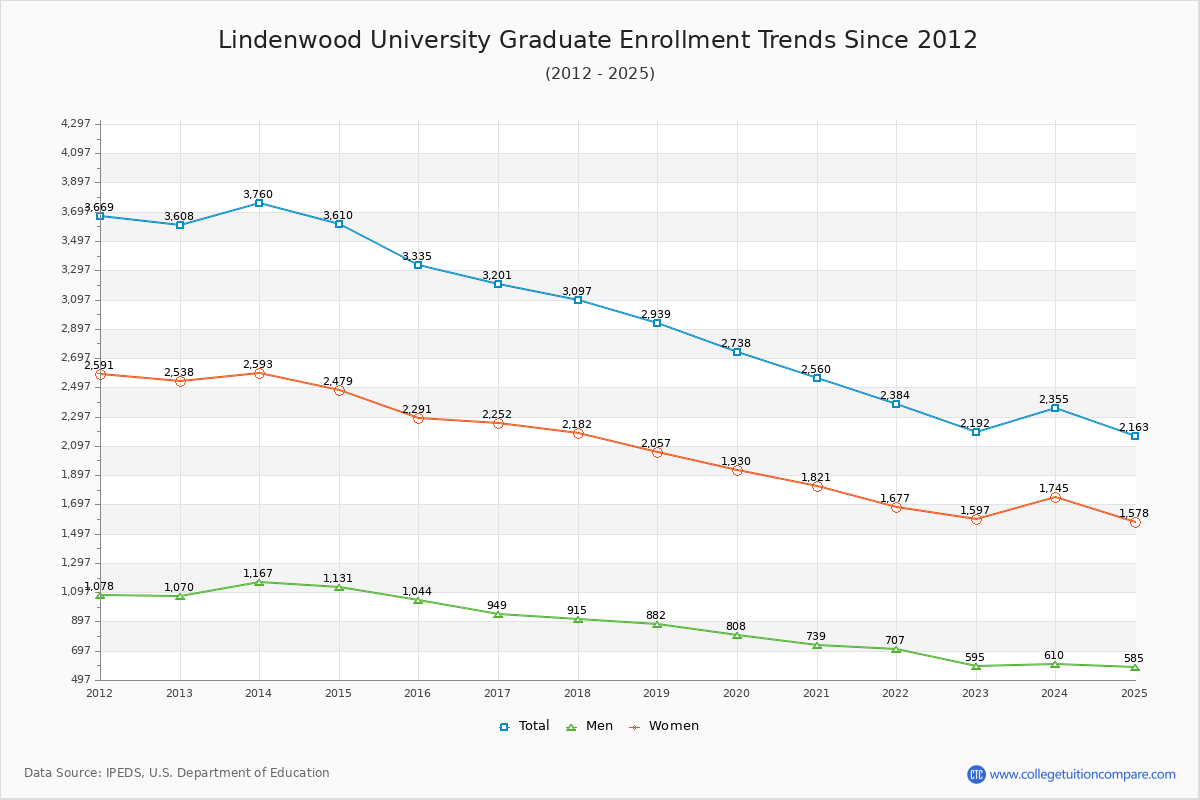
68.69% of total students is undergraduate students and 31.31% students is graduate students. The number of undergraduate students has decreased by 3,488 and the graduate enrollment has decreased by 1,416 over past 10 years.
The female to male ratio is 1.62 to 1 and it means that there are more female students enrolled in Lindenwood than male students.
The following table and chart illustrate the changes in student population by gender at Lindenwood University since 2012.
| Year | Total | Undergraduate | Graduate | ||||
|---|---|---|---|---|---|---|---|
| Total | Men | Women | Total | Men | Women | ||
| 2012-13 | 11,904 | 8,296 | 3,786 | 4,510 | 3,608 | 1,070 | 2,538 |
| 2013-14 | 12,213 309 | 8,453 157 | 3,874 88 | 4,579 69 | 3,760 152 | 1,167 97 | 2,593 55 |
| 2014-15 | 12,151 -62 | 8,541 88 | 3,889 15 | 4,652 73 | 3,610 -150 | 1,131 -36 | 2,479 -114 |
| 2015-16 | 11,620 -531 | 8,285 -256 | 3,729 -160 | 4,556 -96 | 3,335 -275 | 1,044 -87 | 2,291 -188 |
| 2016-17 | 10,750 -870 | 7,549 -736 | 3,445 -284 | 4,104 -452 | 3,201 -134 | 949 -95 | 2,252 -39 |
| 2017-18 | 10,025 -725 | 6,928 -621 | 3,182 -263 | 3,746 -358 | 3,097 -104 | 915 -34 | 2,182 -70 |
| 2018-19 | 9,468 -557 | 6,529 -399 | 3,005 -177 | 3,524 -222 | 2,939 -158 | 882 -33 | 2,057 -125 |
| 2019-20 | 8,392 -1,076 | 5,654 -875 | 2,542 -463 | 3,112 -412 | 2,738 -201 | 808 -74 | 1,930 -127 |
| 2020-21 | 7,382 -1,010 | 4,822 -832 | 2,136 -406 | 2,686 -426 | 2,560 -178 | 739 -69 | 1,821 -109 |
| 2021-22 | 7,003 -379 | 4,619 -203 | 2,030 -106 | 2,589 -97 | 2,384 -176 | 707 -32 | 1,677 -144 |
| 2022-23 | 7,000 -3 | 4,808 189 | 2,080 50 | 2,728 139 | 2,192 -192 | 595 -112 | 1,597 -80 |
| Average | 9,810 | 6,771 | 3,063 | 3,708 | 3,039 | 910 | 2,129 |