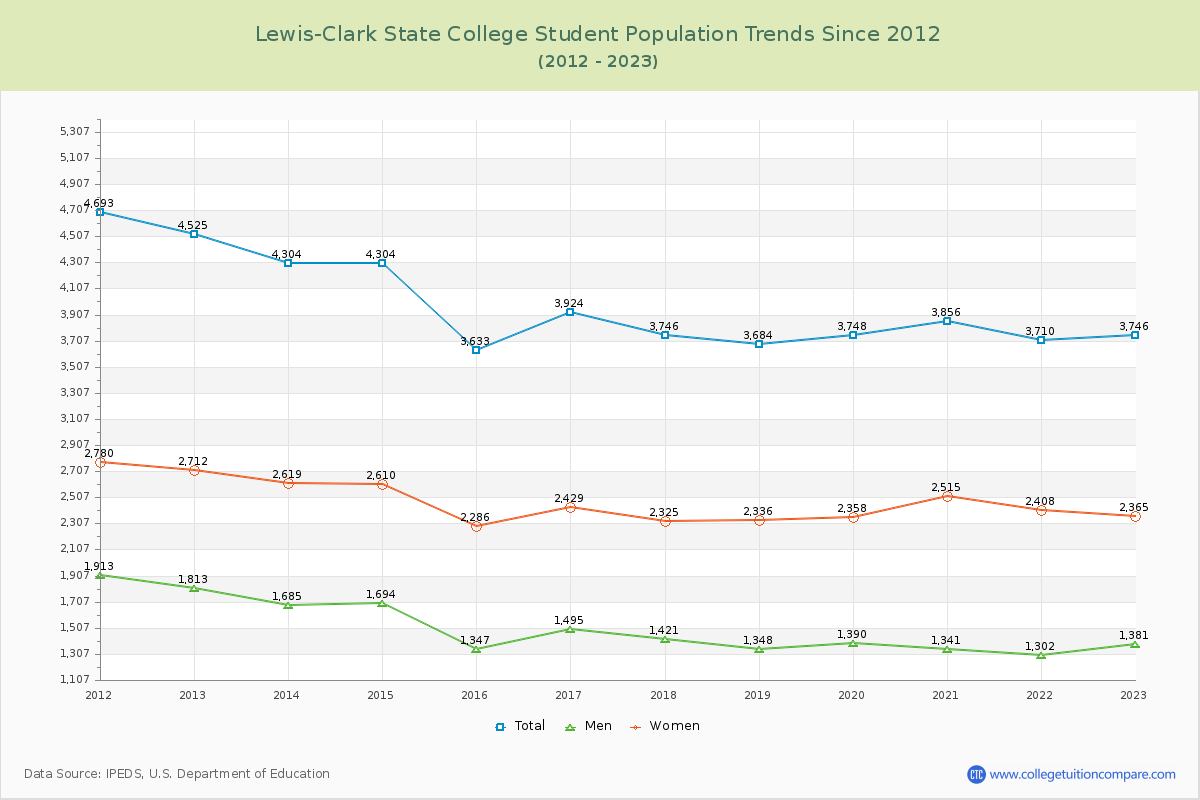
Student Population Changes
The average student population over the last 12 years is 3,925 where 3,746 students are attending the school for the academic year 2022-2023.
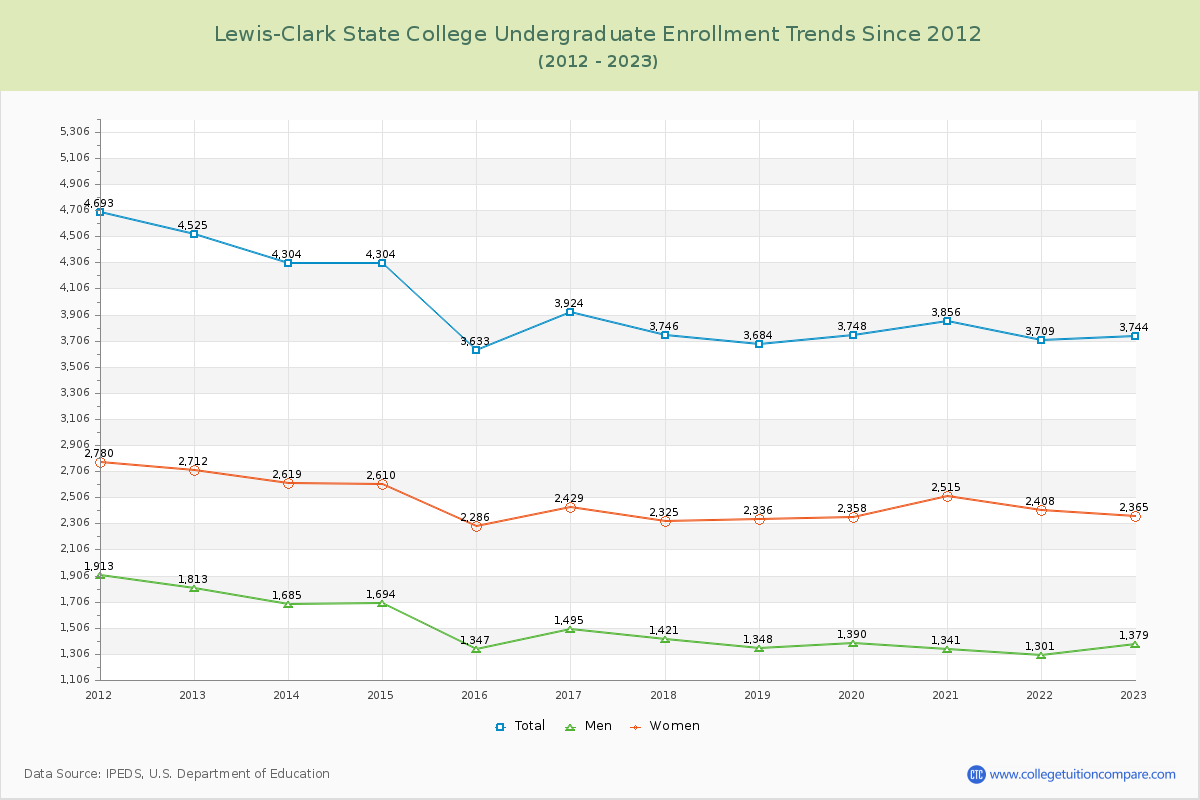
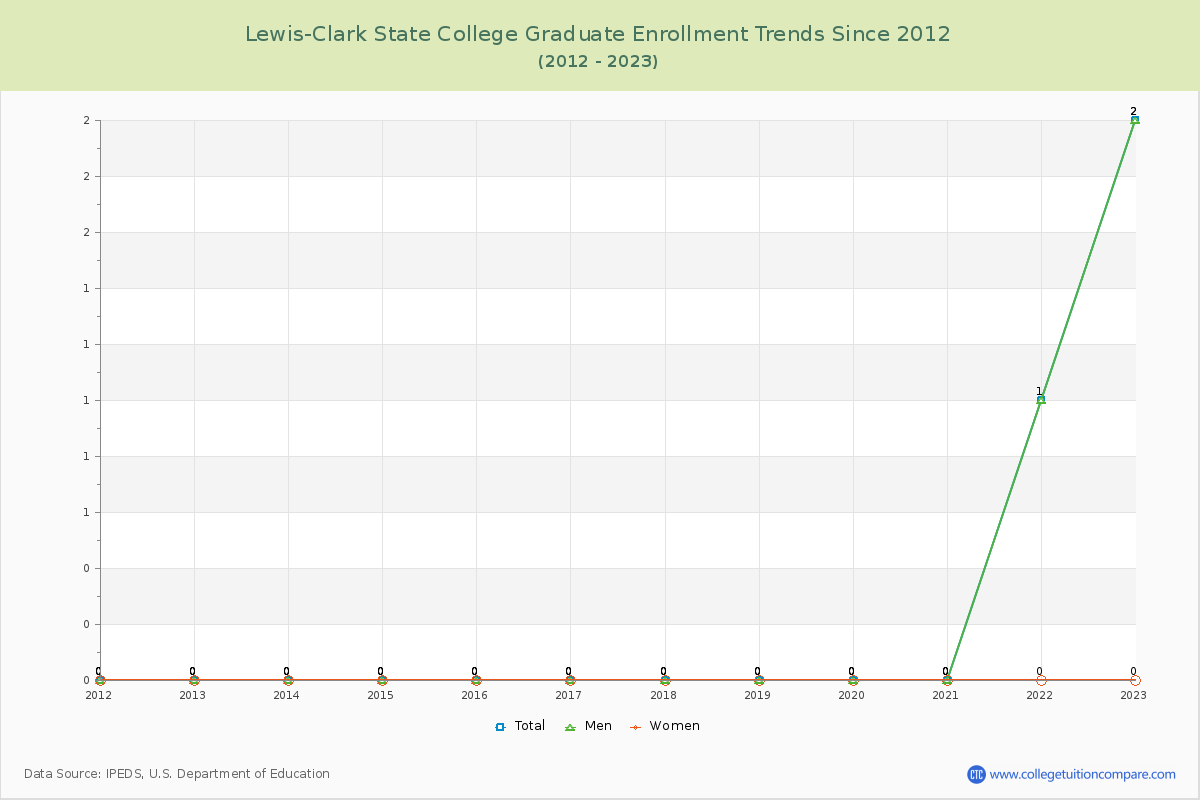
99.95% of total students is undergraduate students and 0.05% students is graduate students. The number of undergraduate students has decreased by 781 and the graduate enrollment has increased by 2 over past 10 years.
The female to male ratio is 1.71 to 1 and it means that there are more female students enrolled in LCSC than male students.
The following table and chart illustrate the changes in student population by gender at Lewis-Clark State College since 2012.
| Year | Total | Undergraduate | Graduate | ||||
|---|---|---|---|---|---|---|---|
| Total | Men | Women | Total | Men | Women | ||
| 2012-13 | 4,525 | 4,525 | 1,813 | 2,712 | 0 | 0 | 0 |
| 2013-14 | 4,304 -221 | 4,304 -221 | 1,685 -128 | 2,619 -93 | 0 0 | 0 0 | 0 0 |
| 2014-15 | 4,304 0 | 4,304 0 | 1,694 9 | 2,610 -9 | 0 0 | 0 0 | 0 0 |
| 2015-16 | 3,633 -671 | 3,633 -671 | 1,347 -347 | 2,286 -324 | 0 0 | 0 0 | 0 0 |
| 2016-17 | 3,924 291 | 3,924 291 | 1,495 148 | 2,429 143 | 0 0 | 0 0 | 0 0 |
| 2017-18 | 3,746 -178 | 3,746 -178 | 1,421 -74 | 2,325 -104 | 0 0 | 0 0 | 0 0 |
| 2018-19 | 3,684 -62 | 3,684 -62 | 1,348 -73 | 2,336 11 | 0 0 | 0 0 | 0 0 |
| 2019-20 | 3,748 64 | 3,748 64 | 1,390 42 | 2,358 22 | 0 0 | 0 0 | 0 0 |
| 2020-21 | 3,856 108 | 3,856 108 | 1,341 -49 | 2,515 157 | 0 0 | 0 0 | 0 0 |
| 2021-22 | 3,710 -146 | 3,709 -147 | 1,301 -40 | 2,408 -107 | 1 1 | 1 1 | 0 0 |
| 2022-23 | 3,746 36 | 3,744 35 | 1,379 78 | 2,365 -43 | 2 1 | 2 1 | 0 0 |
| Average | 3,925 | 3,925 | 1,474 | 2,451 | 0 | 0 | 0 |