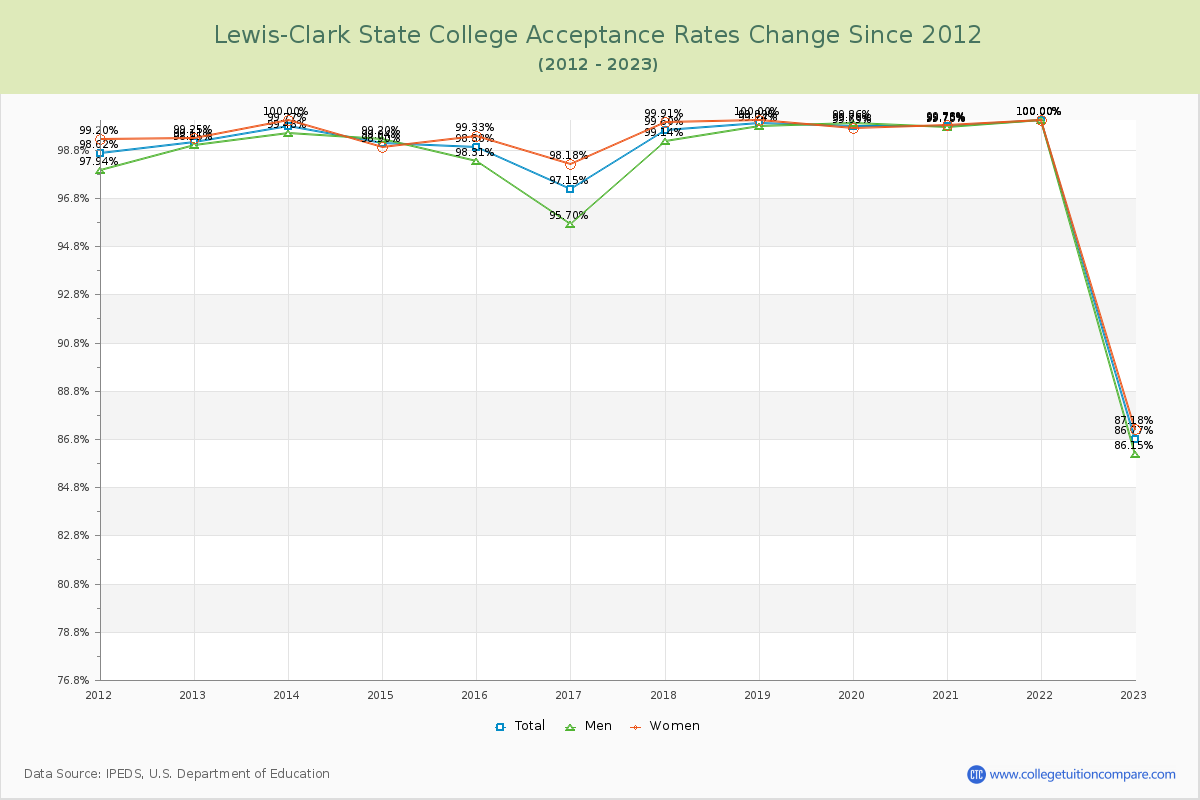
Acceptance Rate Changes
The average acceptance rate over the last 10 years is 98.16%, and this year's acceptance rate is 86.77% at Lewis-Clark State College. By gender, men students' acceptance rate is 97.84% and women students' rate is 98.38%. For 2023 admission, it was slightly harder to get into Lewis-Clark State College than the previous year.
The next table and chart illustrate the acceptance rates changes at Lewis-Clark State College over the past 11 years (2012-2023).
| Year | Total | Men | Women |
|---|---|---|---|
| 2012-13 | 99.11% | 98.95% | 99.25% |
| 2013-14 | 99.77% 0.66% |
99.48% 0.75% |
100.00% 0.75% |
| 2014-15 | 99.04% -0.73% |
99.20% -1.10% |
98.90% -1.10% |
| 2015-16 | 98.88% -0.15% |
98.31% 0.44% |
99.33% 0.44% |
| 2016-17 | 97.15% -1.73% |
95.70% -1.16% |
98.18% -1.16% |
| 2017-18 | 99.60% 2.45% |
99.14% 1.73% |
99.91% 1.73% |
| 2018-19 | 99.89% 0.29% |
99.74% 0.09% |
100.00% 0.09% |
| 2019-20 | 99.76% -0.13% |
99.86% -0.31% |
99.69% -0.31% |
| 2020-21 | 99.75% -0.02% |
99.70% 0.10% |
99.78% 0.10% |
| 2021-22 | 100.00% 0.25% |
100.00% 0.22% |
100.00% 0.22% |
| 2022-23 | 86.77% -13.23% |
86.15% -12.82% |
87.18% -12.82% |
| Average | 98.16% | 97.84% | 98.38% |