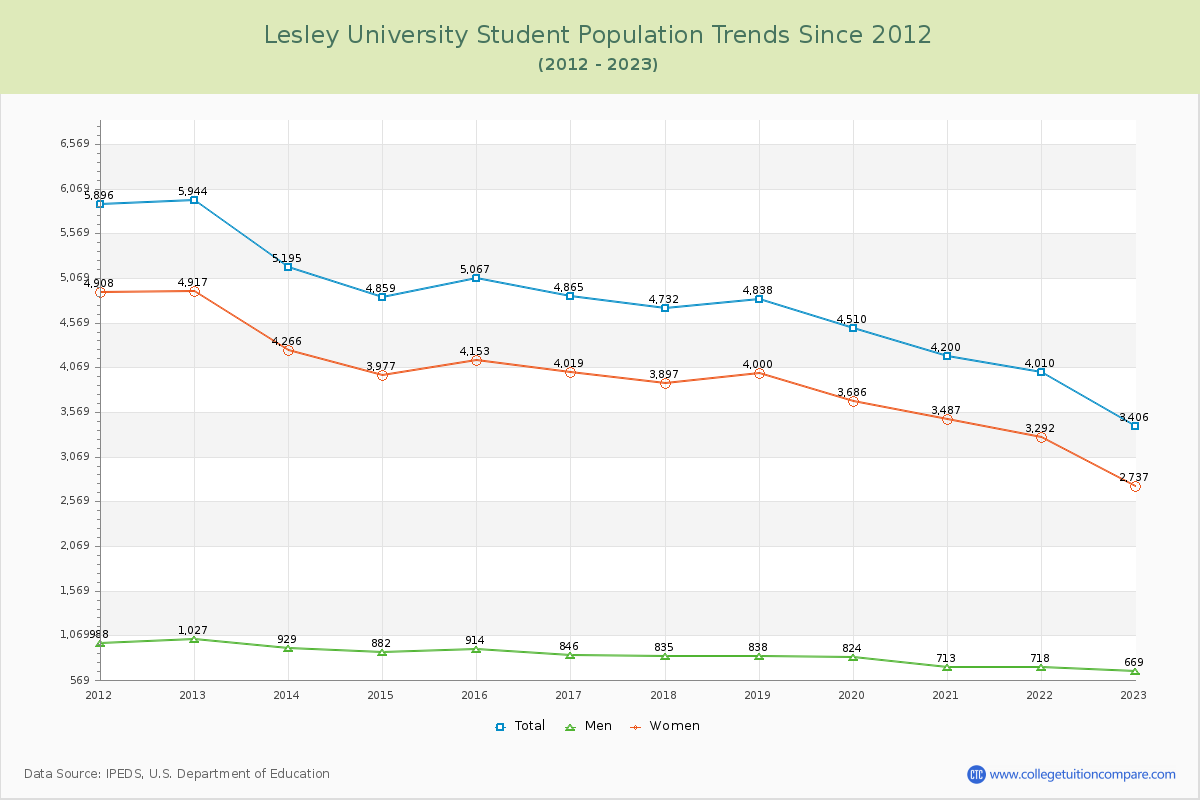
Student Population Changes
The average student population over the last 12 years is 4,693 where 3,406 students are attending the school for the academic year 2022-2023.
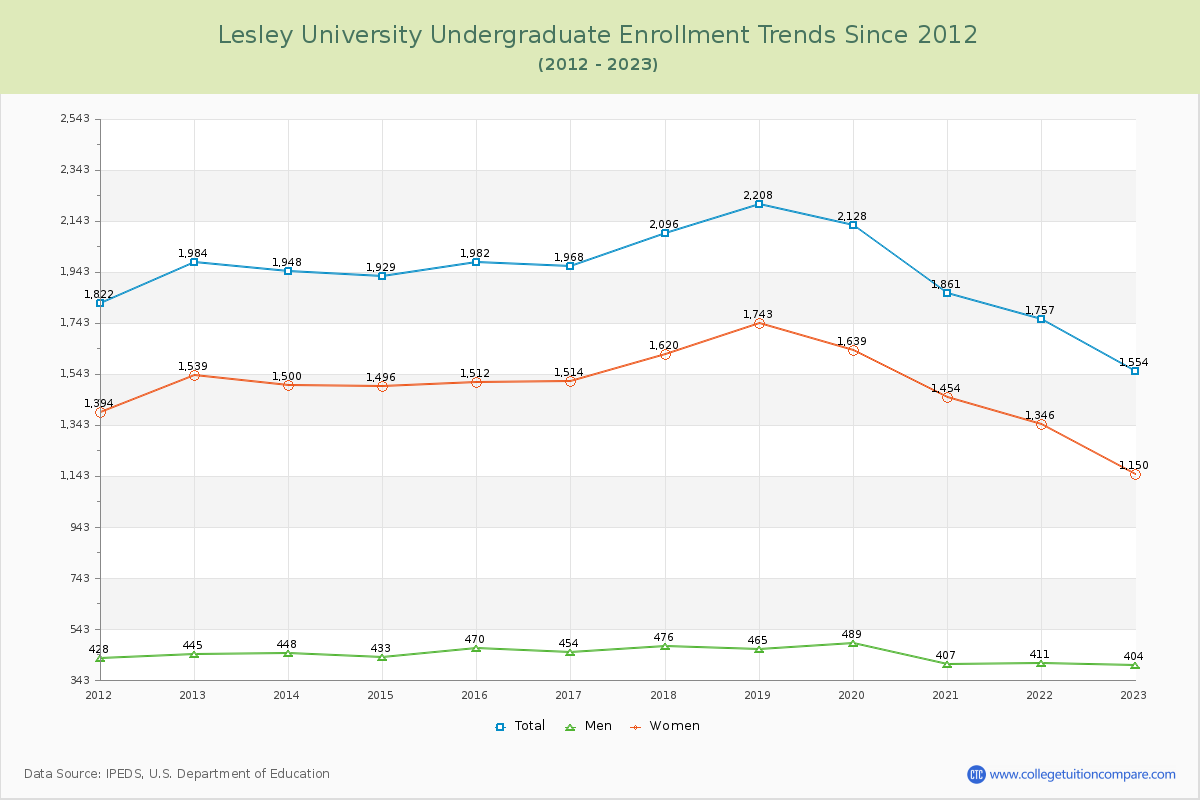
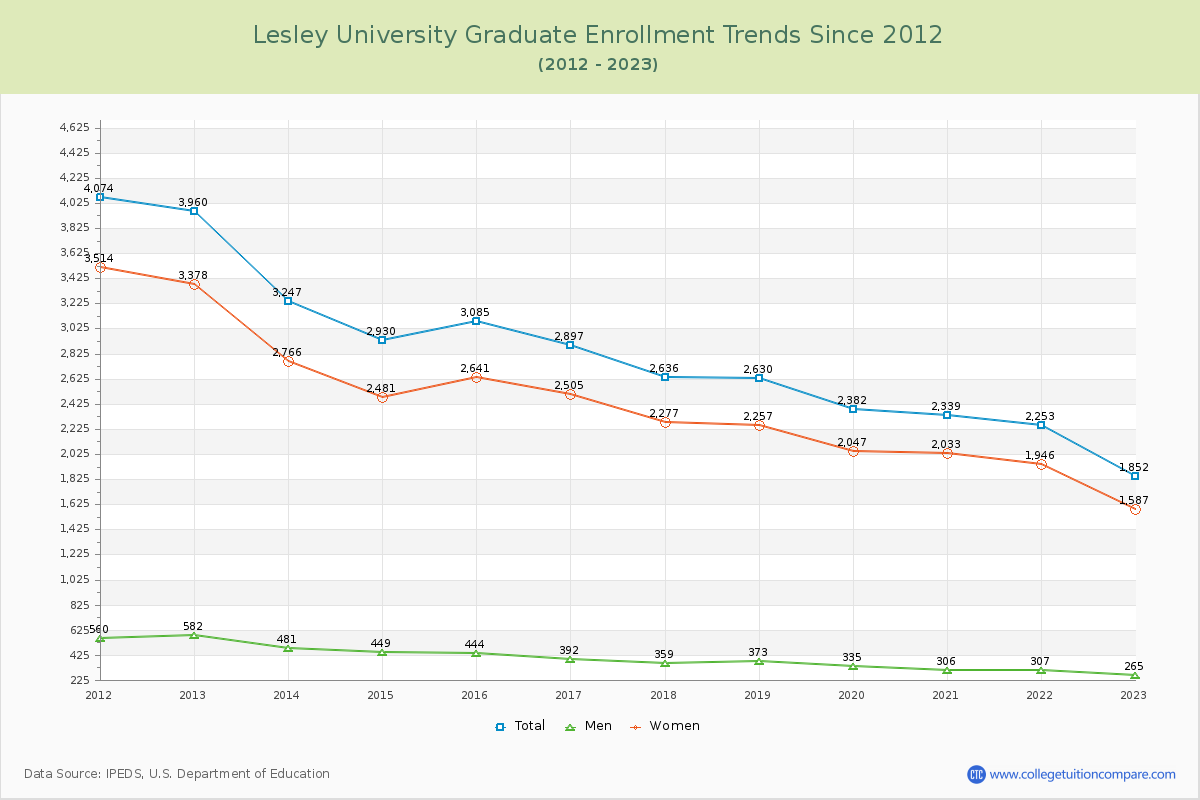
45.63% of total students is undergraduate students and 54.37% students is graduate students. The number of undergraduate students has decreased by 430 and the graduate enrollment has decreased by 2,108 over past 10 years.
The female to male ratio is 4.09 to 1 and it means that there are far more female students enrolled in Lesley than male students.
The following table and chart illustrate the changes in student population by gender at Lesley University since 2012.
| Year | Total | Undergraduate | Graduate | ||||
|---|---|---|---|---|---|---|---|
| Total | Men | Women | Total | Men | Women | ||
| 2012-13 | 5,944 | 1,984 | 445 | 1,539 | 3,960 | 582 | 3,378 |
| 2013-14 | 5,195 -749 | 1,948 -36 | 448 3 | 1,500 -39 | 3,247 -713 | 481 -101 | 2,766 -612 |
| 2014-15 | 4,859 -336 | 1,929 -19 | 433 -15 | 1,496 -4 | 2,930 -317 | 449 -32 | 2,481 -285 |
| 2015-16 | 5,067 208 | 1,982 53 | 470 37 | 1,512 16 | 3,085 155 | 444 -5 | 2,641 160 |
| 2016-17 | 4,865 -202 | 1,968 -14 | 454 -16 | 1,514 2 | 2,897 -188 | 392 -52 | 2,505 -136 |
| 2017-18 | 4,732 -133 | 2,096 128 | 476 22 | 1,620 106 | 2,636 -261 | 359 -33 | 2,277 -228 |
| 2018-19 | 4,838 106 | 2,208 112 | 465 -11 | 1,743 123 | 2,630 -6 | 373 14 | 2,257 -20 |
| 2019-20 | 4,510 -328 | 2,128 -80 | 489 24 | 1,639 -104 | 2,382 -248 | 335 -38 | 2,047 -210 |
| 2020-21 | 4,200 -310 | 1,861 -267 | 407 -82 | 1,454 -185 | 2,339 -43 | 306 -29 | 2,033 -14 |
| 2021-22 | 4,010 -190 | 1,757 -104 | 411 4 | 1,346 -108 | 2,253 -86 | 307 1 | 1,946 -87 |
| 2022-23 | 3,406 -604 | 1,554 -203 | 404 -7 | 1,150 -196 | 1,852 -401 | 265 -42 | 1,587 -359 |
| Average | 4,693 | 1,947 | 446 | 1,501 | 2,746 | 390 | 2,356 |