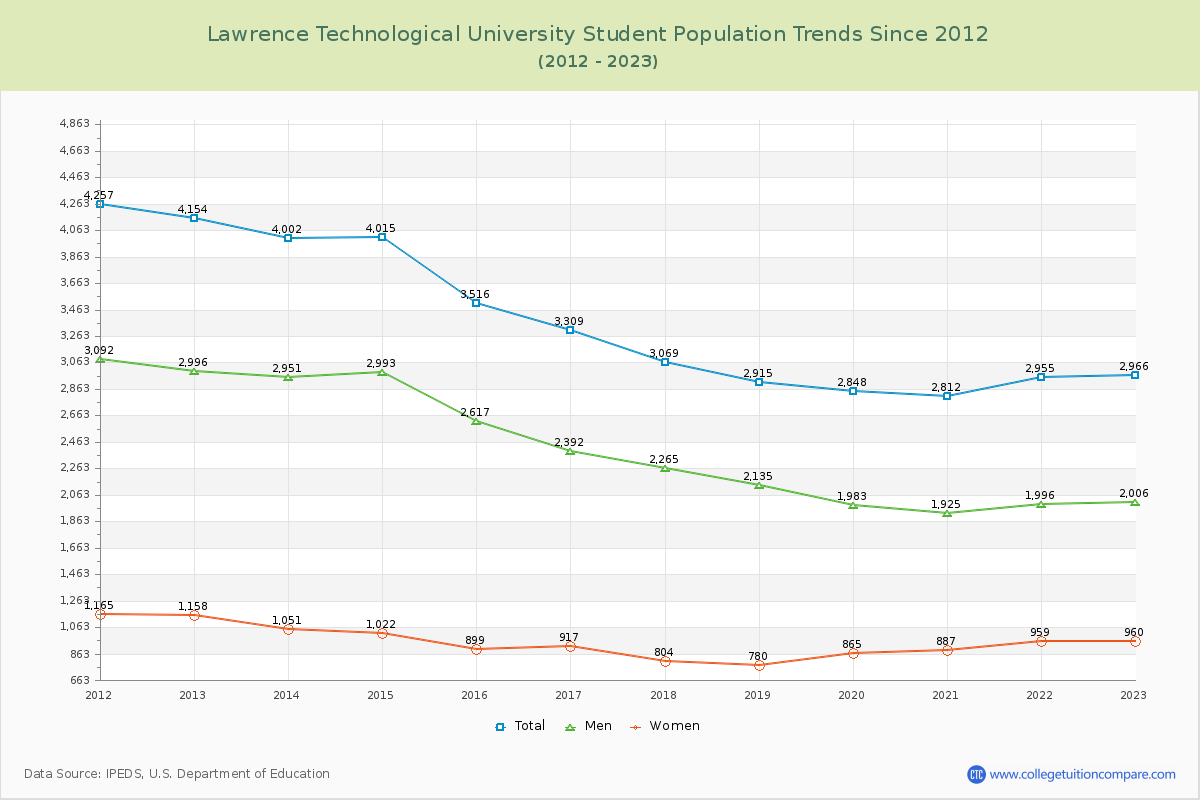
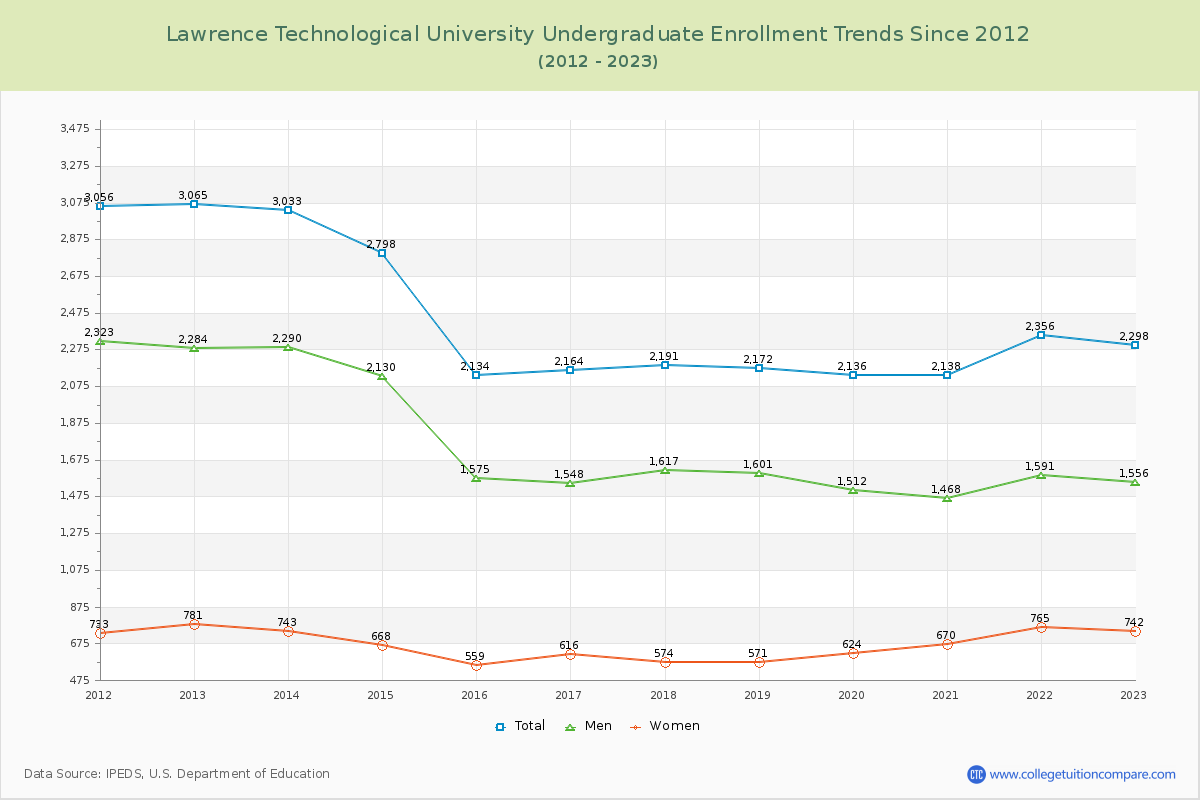
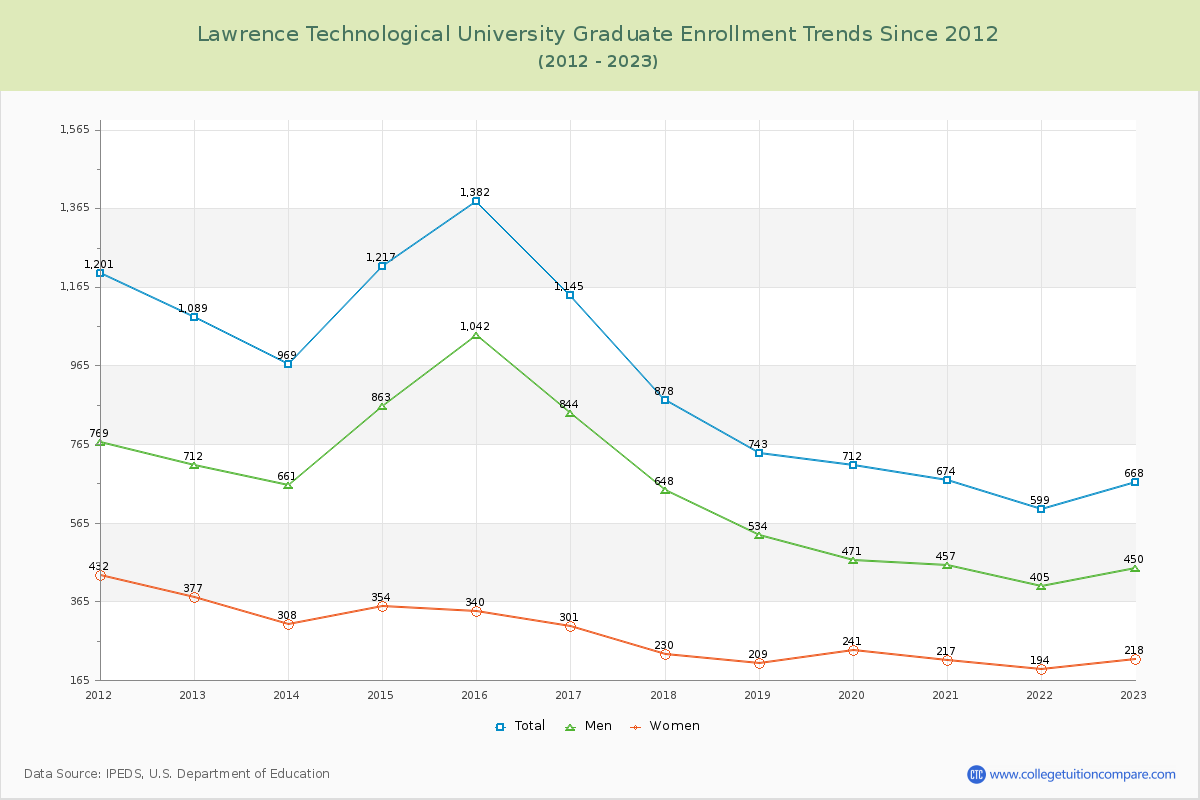
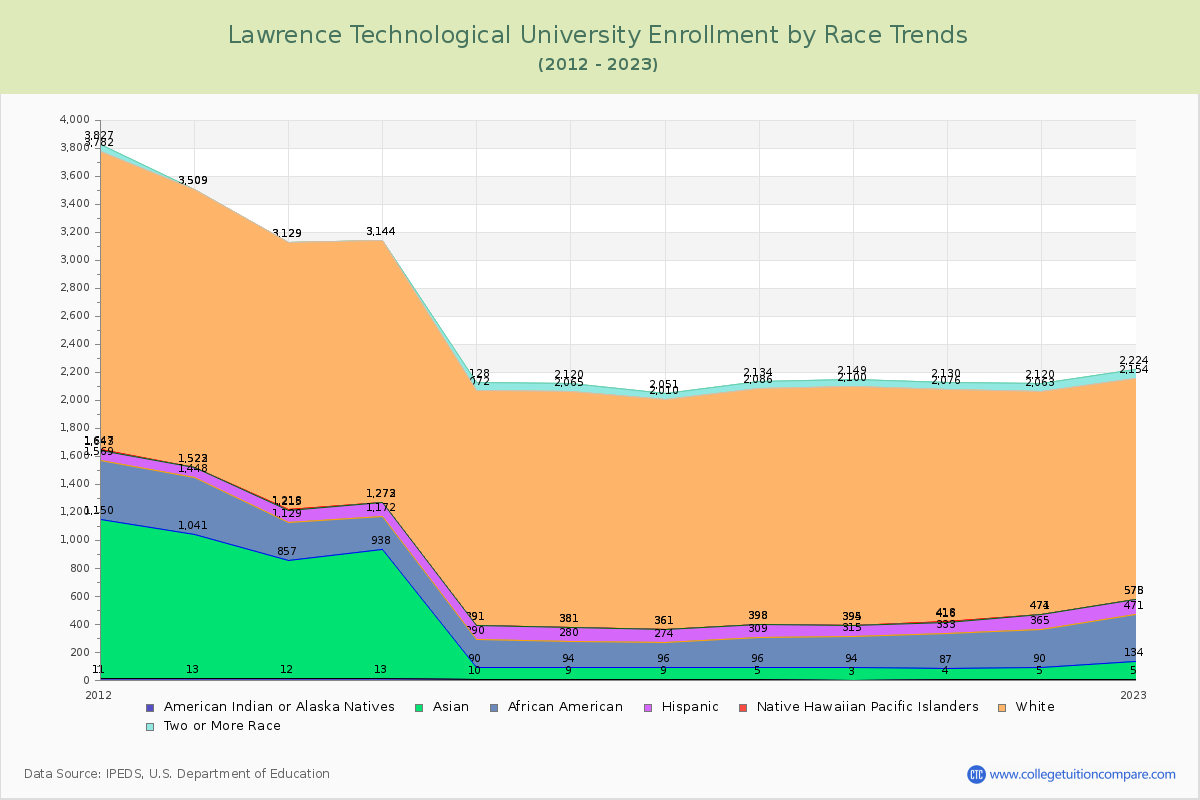
Student Population Changes
The average student population over the last 12 years is 3,324 where 2,966 students are attending the school for the academic year 2022-2023.
77.48% of total students is undergraduate students and 22.52% students is graduate students. The number of undergraduate students has decreased by 767 and the graduate enrollment has decreased by 421 over past 10 years.
The female to male ratio is 0.48 to 1 and it means that there are far more male students enrolled in Lawrence Technological than female students.
The following table and chart illustrate the changes in student population by gender at Lawrence Technological University since 2012.
| Year | Total | Undergraduate | Graduate | ||||
|---|---|---|---|---|---|---|---|
| Total | Men | Women | Total | Men | Women | ||
| 2012-13 | 4,154 | 3,065 | 2,284 | 781 | 1,089 | 712 | 377 |
| 2013-14 | 4,002 -152 | 3,033 -32 | 2,290 6 | 743 -38 | 969 -120 | 661 -51 | 308 -69 |
| 2014-15 | 4,015 13 | 2,798 -235 | 2,130 -160 | 668 -75 | 1,217 248 | 863 202 | 354 46 |
| 2015-16 | 3,516 -499 | 2,134 -664 | 1,575 -555 | 559 -109 | 1,382 165 | 1,042 179 | 340 -14 |
| 2016-17 | 3,309 -207 | 2,164 30 | 1,548 -27 | 616 57 | 1,145 -237 | 844 -198 | 301 -39 |
| 2017-18 | 3,069 -240 | 2,191 27 | 1,617 69 | 574 -42 | 878 -267 | 648 -196 | 230 -71 |
| 2018-19 | 2,915 -154 | 2,172 -19 | 1,601 -16 | 571 -3 | 743 -135 | 534 -114 | 209 -21 |
| 2019-20 | 2,848 -67 | 2,136 -36 | 1,512 -89 | 624 53 | 712 -31 | 471 -63 | 241 32 |
| 2020-21 | 2,812 -36 | 2,138 2 | 1,468 -44 | 670 46 | 674 -38 | 457 -14 | 217 -24 |
| 2021-22 | 2,955 143 | 2,356 218 | 1,591 123 | 765 95 | 599 -75 | 405 -52 | 194 -23 |
| 2022-23 | 2,966 11 | 2,298 -58 | 1,556 -35 | 742 -23 | 668 69 | 450 45 | 218 24 |
| Average | 3,324 | 2,408 | 1,743 | 665 | 916 | 644 | 272 |