Student Population by Gender
Lawrence Technological University has a total of 2,966 enrolled students for the academic year 2022-2023. 2,298 students have enrolled in undergraduate programs and 668 students joined graduate programs.
By gender, 2,006 male and 960 female students (the male-female ratio is 68:32) are attending the school. The gender distribution is based on the 2022-2023 data.
| Total | Undergraduate | Graduate | |
|---|---|---|---|
| Total | 2,966 | 2,298 | 668 |
| Men | 2,006 | 1,556 | 450 |
| Women | 960 | 742 | 218 |
Student Distribution by Race/Ethnicity
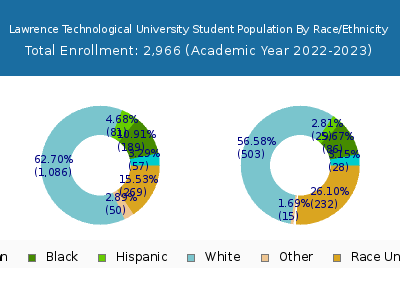
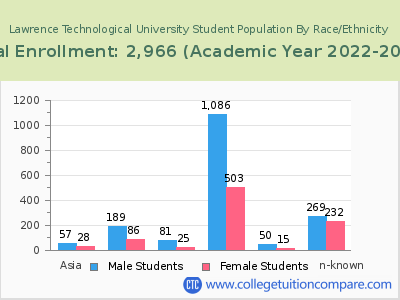
| Race | Total | Men | Women |
|---|---|---|---|
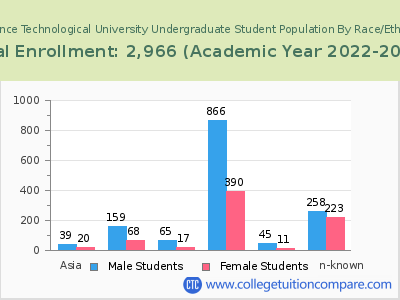
| American Indian or Native American | 5 | 3 | 2 |
| Asian | 129 | 91 | 38 |
| Black | 337 | 194 | 143 |
| Hispanic | 104 | 74 | 30 |
| Native Hawaiian or Other Pacific Islanders | 3 | 3 | 0 |
| White | 1,576 | 1,066 | 510 |
| Two or more races | 70 | 52 | 18 |
| Race Unknown | 286 | 152 | 134 |
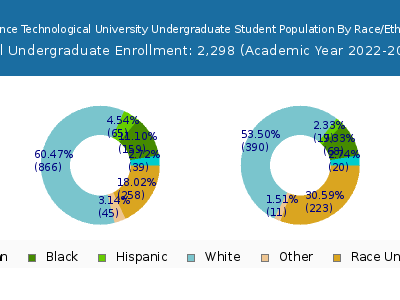
| Race | Total | Men | Women |
|---|---|---|---|
| American Indian or Native American | 5 | 3 | 2 |
| Asian | 101 | 74 | 27 |
| Black | 297 | 169 | 128 |
| Hispanic | 85 | 62 | 23 |
| Native Hawaiian or Other Pacific Islanders | 3 | 3 | 0 |
| White | 1,262 | 860 | 402 |
| Two or more races | 65 | 47 | 18 |
| Race Unknown | 233 | 129 | 104 |
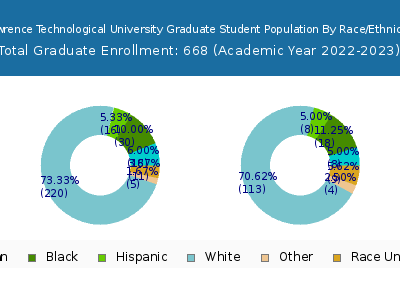
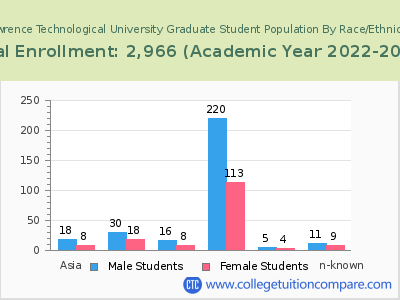
| Race | Total | Men | Women |
|---|---|---|---|
| American Indian or Native American | 0 | 0 | 0 |
| Asian | 3 | 3 | 0 |
| Black | 5 | 4 | 1 |
| Hispanic | 1 | 1 | 0 |
| Native Hawaiian or Other Pacific Islanders | 1 | 1 | 0 |
| White | 40 | 28 | 12 |
| Two or more races | 3 | 2 | 1 |
| Race Unknown | 7 | 4 | 3 |
Student Age Distribution
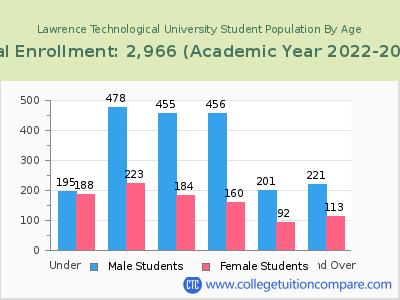
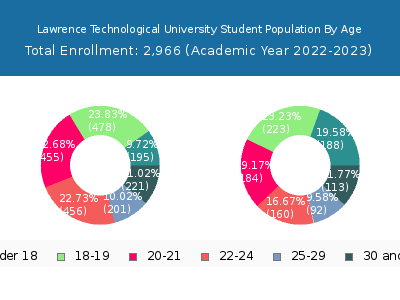
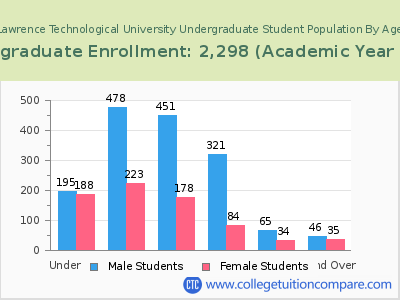
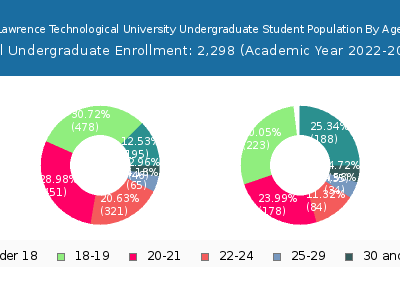
By age, Lawrence Technological has 383 students under 18 years old and 1 students over 65 years old. There are 2,339 students under 25 years old, and 627 students over 25 years old out of 2,966 total students.
In undergraduate programs, 383 students are younger than 18 and 1 students are older than 65. Lawrence Technological has 2,118 undergraduate students aged under 25 and 180 students aged 25 and over.
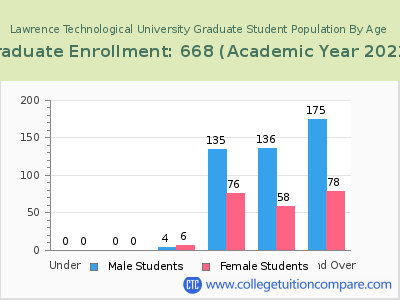
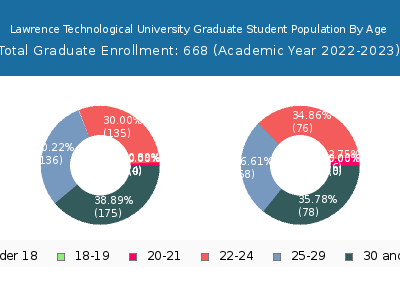
It has 221 graduate students aged under 25 and 447 students aged 25 and over.
| Age | Total | Men | Women |
|---|---|---|---|
| Under 18 | 383 | 188 | 195 |
| 18-19 | 701 | 223 | 478 |
| 20-21 | 639 | 184 | 455 |
| 22-24 | 616 | 160 | 456 |
| 25-29 | 293 | 92 | 201 |
| 30-34 | 127 | 43 | 84 |
| 35-39 | 73 | 22 | 51 |
| 40-49 | 99 | 36 | 63 |
| 50-64 | 34 | 12 | 22 |
| Over 65 | 1 | 0 | 1 |
| Age | Total | Men | Women |
|---|---|---|---|
| Under 18 | 383 | 188 | 195 |
| 18-19 | 701 | 223 | 478 |
| 20-21 | 629 | 178 | 451 |
| 22-24 | 405 | 84 | 321 |
| 25-29 | 99 | 34 | 65 |
| 30-34 | 37 | 14 | 23 |
| 35-39 | 12 | 5 | 7 |
| 40-49 | 22 | 11 | 11 |
| 50-64 | 9 | 5 | 4 |
| Over 65 | 1 | 0 | 1 |
| Age | Total | Men | Women |
|---|
Online Student Enrollment
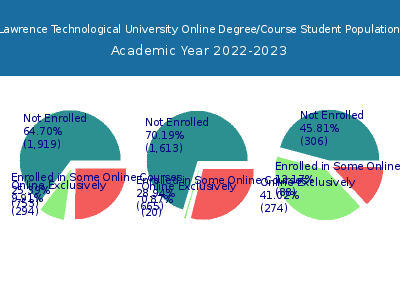
Distance learning, also called online education, is very attractive to students, especially who want to continue education and work in field. At Lawrence Technological University, 294 students are enrolled exclusively in online courses and 753 students are enrolled in some online courses.
185 students lived in Michigan or jurisdiction in which the school is located are enrolled exclusively in online courses and 109 students live in other State or outside of the United States.
| All Students | Enrolled Exclusively Online Courses | Enrolled in Some Online Courses | |
|---|---|---|---|
| All Students | 2,966 | 294 | 753 |
| Undergraduate | 2,298 | 20 | 665 |
| Graduate | 668 | 274 | 88 |
| Michigan Residents | Other States in U.S. | Outside of U.S. | |
|---|---|---|---|
| All Students | 185 | 89 | 20 |
| Undergraduate | 19 | 1 | 0 |
| Graduate | 166 | 88 | 20 |
Transfer-in Students (Undergraduate)
Among 2,298 enrolled in undergraduate programs, 91 students have transferred-in from other institutions. The percentage of transfer-in students is 3.96%.81 students have transferred in as full-time status and 10 students transferred in as part-time status.
| Number of Students | |
|---|---|
| Regular Full-time | 1,615 |
| Transfer-in Full-time | 81 |
| Regular Part-time | 592 |
| Transfer-in Part-time | 10 |
