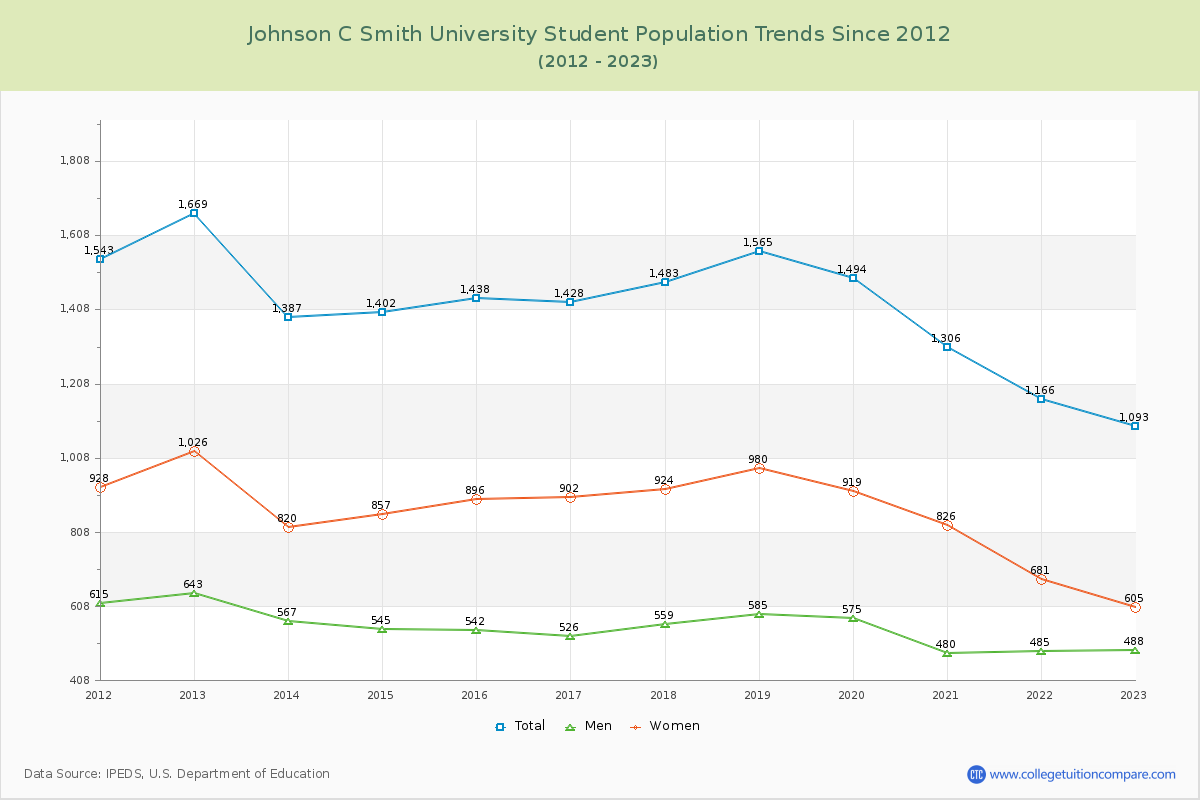
Student Population Changes
The average student population over the last 12 years is 1,403 where 1,093 students are attending the school for the academic year 2022-2023.
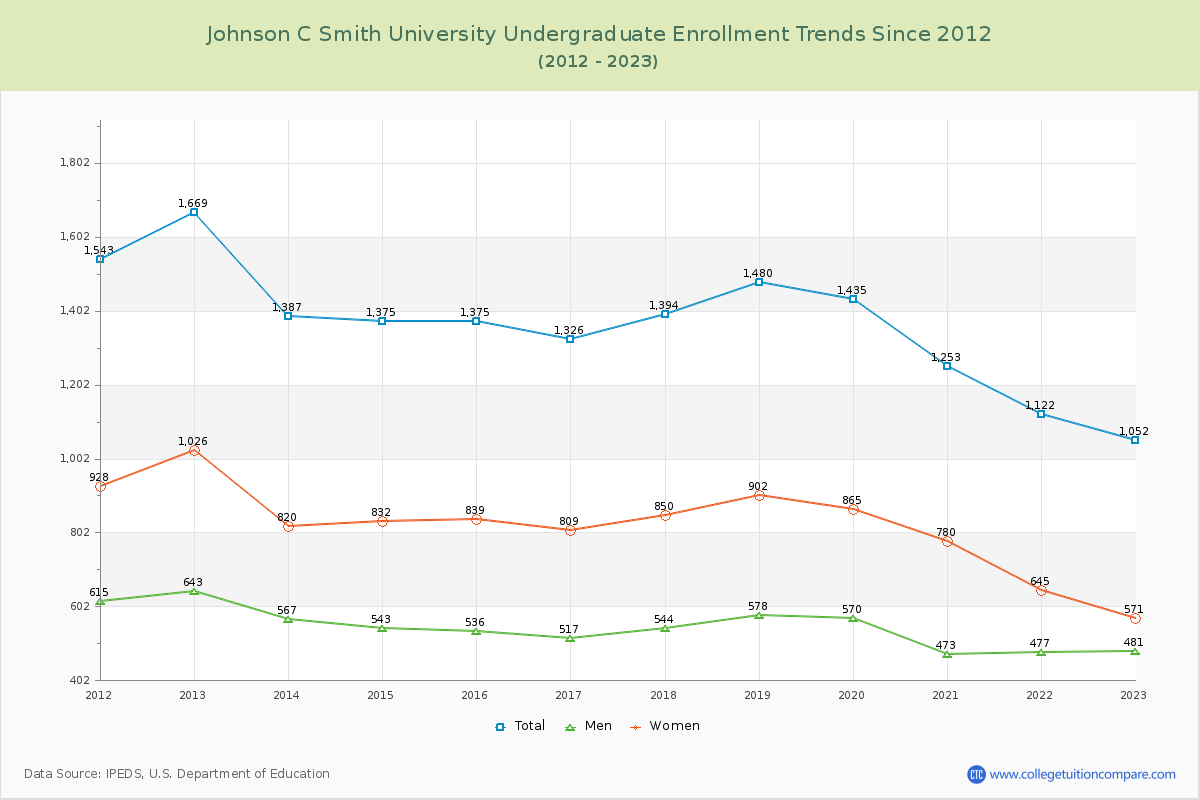
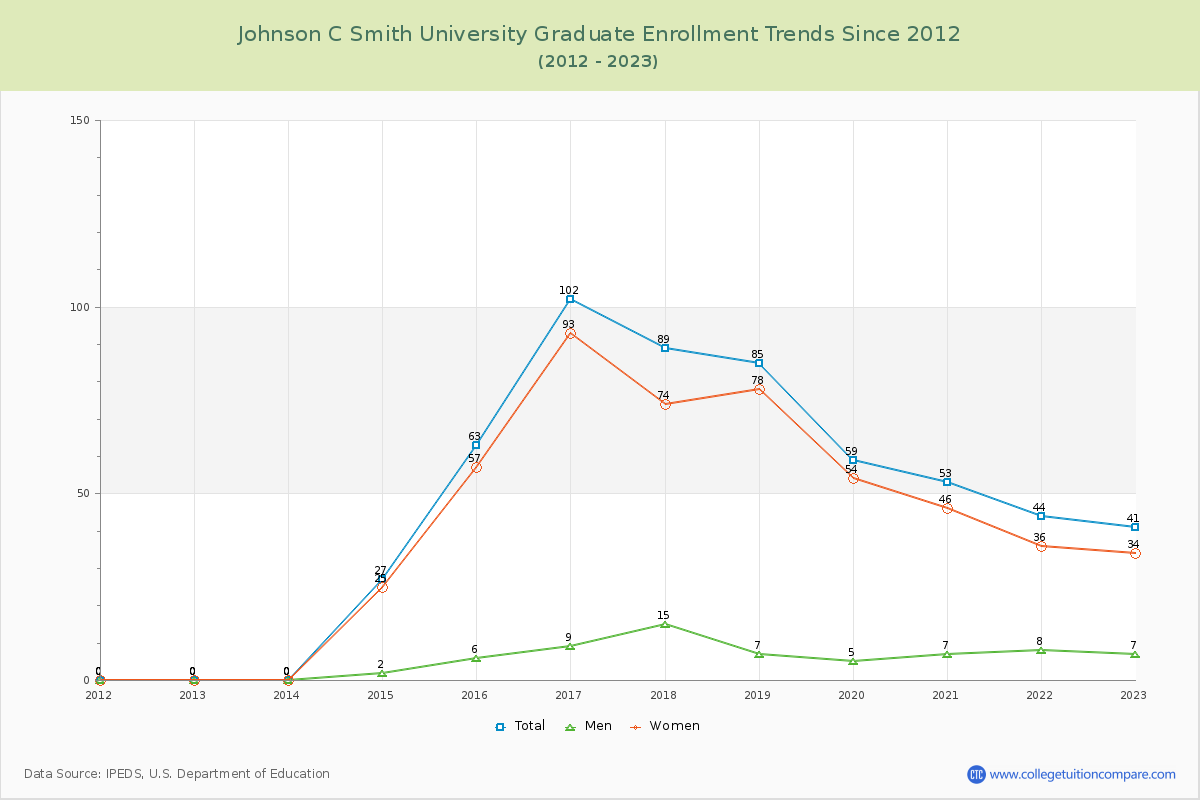
96.25% of total students is undergraduate students and 3.75% students is graduate students. The number of undergraduate students has decreased by 617 and the graduate enrollment has increased by 41 over past 10 years.
The female to male ratio is 1.24 to 1 and it means that there are slightly more female students enrolled in JCSU than male students.
The following table and chart illustrate the changes in student population by gender at Johnson C Smith University since 2012.
| Year | Total | Undergraduate | Graduate | ||||
|---|---|---|---|---|---|---|---|
| Total | Men | Women | Total | Men | Women | ||
| 2012-13 | 1,669 | 1,669 | 643 | 1,026 | 0 | 0 | 0 |
| 2013-14 | 1,387 -282 | 1,387 -282 | 567 -76 | 820 -206 | 0 0 | 0 0 | 0 0 |
| 2014-15 | 1,402 15 | 1,375 -12 | 543 -24 | 832 12 | 27 27 | 2 2 | 25 25 |
| 2015-16 | 1,438 36 | 1,375 0 | 536 -7 | 839 7 | 63 36 | 6 4 | 57 32 |
| 2016-17 | 1,428 -10 | 1,326 -49 | 517 -19 | 809 -30 | 102 39 | 9 3 | 93 36 |
| 2017-18 | 1,483 55 | 1,394 68 | 544 27 | 850 41 | 89 -13 | 15 6 | 74 -19 |
| 2018-19 | 1,565 82 | 1,480 86 | 578 34 | 902 52 | 85 -4 | 7 -8 | 78 4 |
| 2019-20 | 1,494 -71 | 1,435 -45 | 570 -8 | 865 -37 | 59 -26 | 5 -2 | 54 -24 |
| 2020-21 | 1,306 -188 | 1,253 -182 | 473 -97 | 780 -85 | 53 -6 | 7 2 | 46 -8 |
| 2021-22 | 1,166 -140 | 1,122 -131 | 477 4 | 645 -135 | 44 -9 | 8 1 | 36 -10 |
| 2022-23 | 1,093 -73 | 1,052 -70 | 481 4 | 571 -74 | 41 -3 | 7 -1 | 34 -2 |
| Average | 1,403 | 1,352 | 539 | 813 | 51 | 6 | 45 |