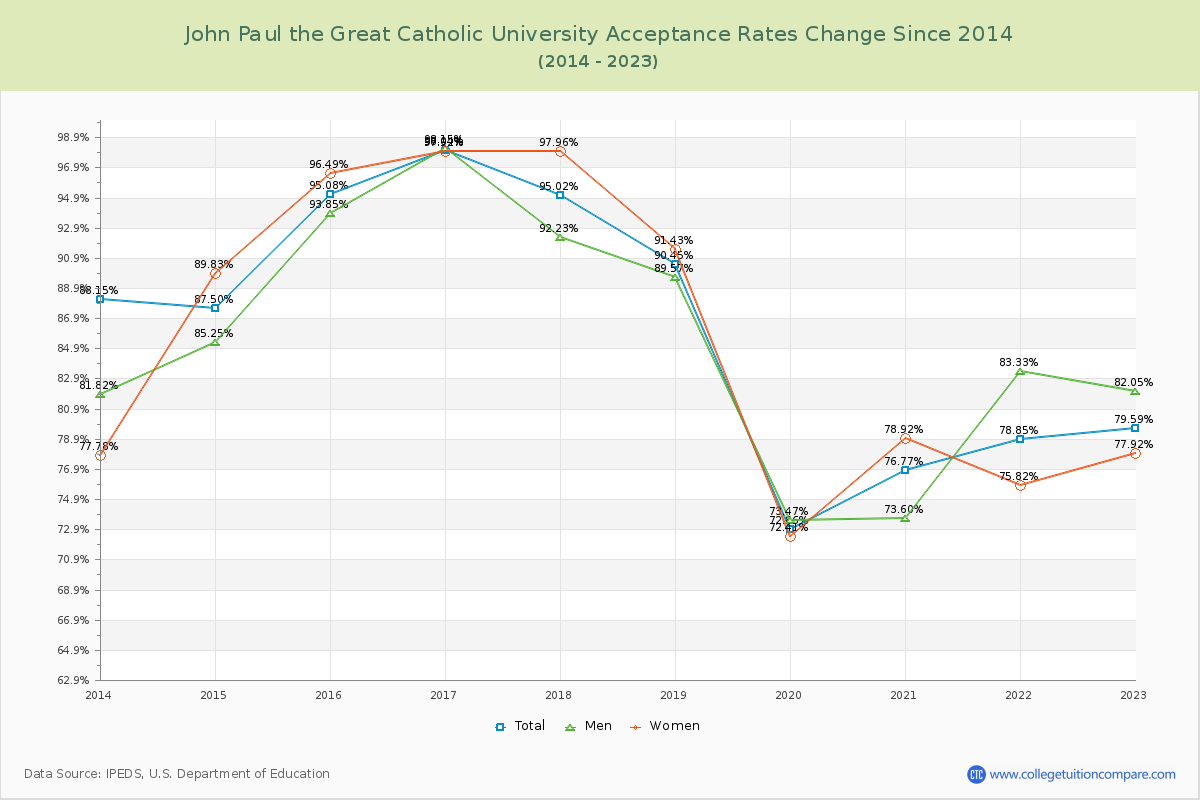
Acceptance Rate Changes
The average acceptance rate over the last 10 years is 86.23%, and this year's acceptance rate is 79.59% at John Paul the Great Catholic University. By gender, men students' acceptance rate is 85.33% and women students' rate is 85.65%. The acceptance rate at John Paul the Great Catholic University have not been tight and applicants have much more chance to admit.
The next table and chart illustrate the acceptance rates changes at John Paul the Great Catholic University over the past 10 years (2013-2023).
| Year | Total | Men | Women |
|---|---|---|---|
| 2013-14 | 88.15% | 81.82% | 77.78% |
| 2014-15 | 87.50% -0.65% |
85.25% 12.05% |
89.83% 12.05% |
| 2015-16 | 95.08% 7.58% |
93.85% 6.66% |
96.49% 6.66% |
| 2016-17 | 98.04% 2.96% |
98.15% 1.43% |
97.92% 1.43% |
| 2017-18 | 95.02% -3.01% |
92.23% 0.04% |
97.96% 0.04% |
| 2018-19 | 90.45% -4.57% |
89.57% -6.53% |
91.43% -6.53% |
| 2019-20 | 72.86% -17.60% |
73.47% -19.01% |
72.41% -19.01% |
| 2020-21 | 76.77% 3.92% |
73.60% 6.51% |
78.92% 6.51% |
| 2021-22 | 78.85% 2.08% |
83.33% -3.10% |
75.82% -3.10% |
| 2022-23 | 79.59% 0.73% |
82.05% 2.11% |
77.92% 2.11% |
| Average | 86.23% | 85.33% | 85.65% |