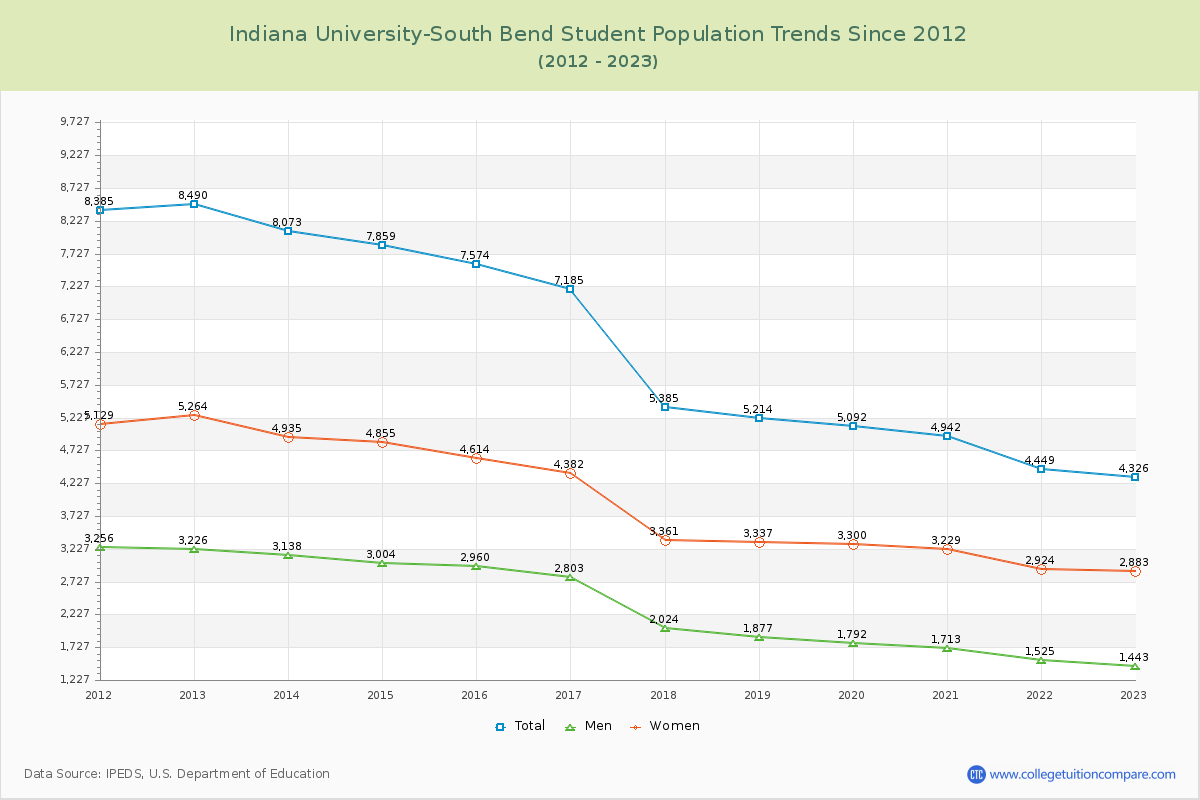
Student Population Changes
The average student population over the last 12 years is 6,235 where 4,326 students are attending the school for the academic year 2022-2023.
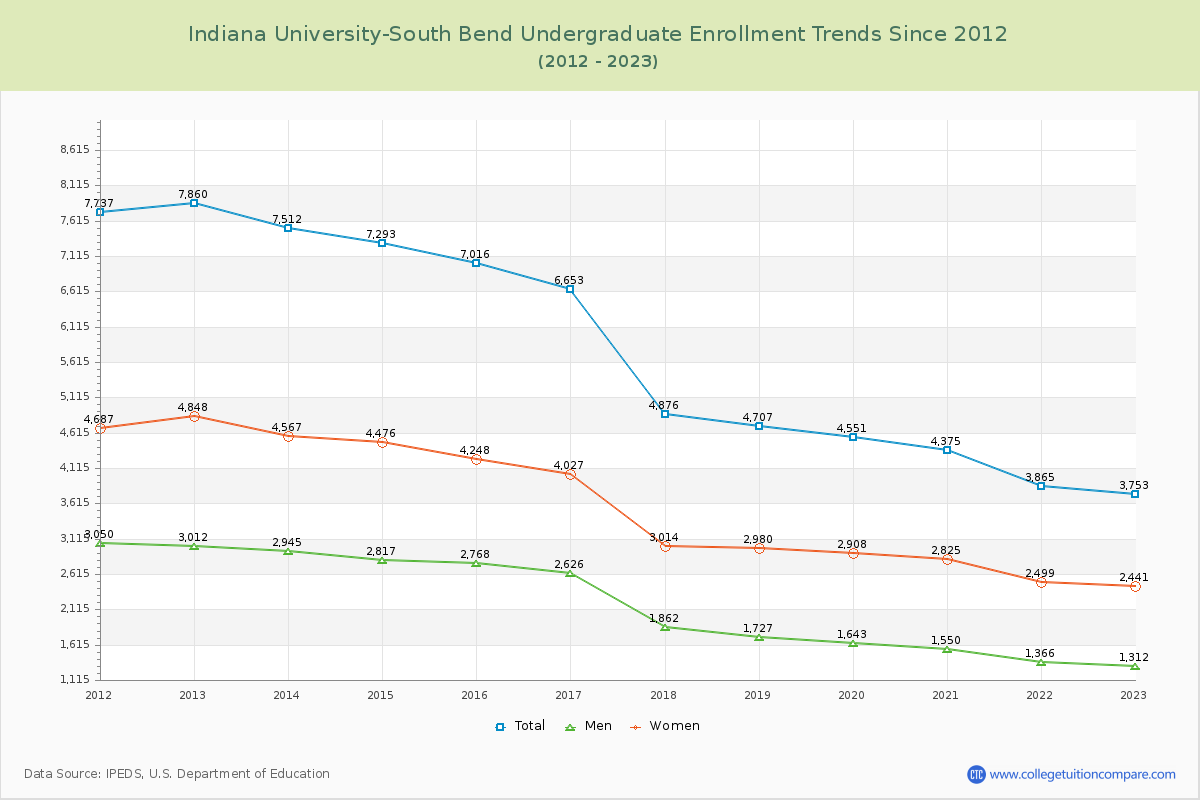
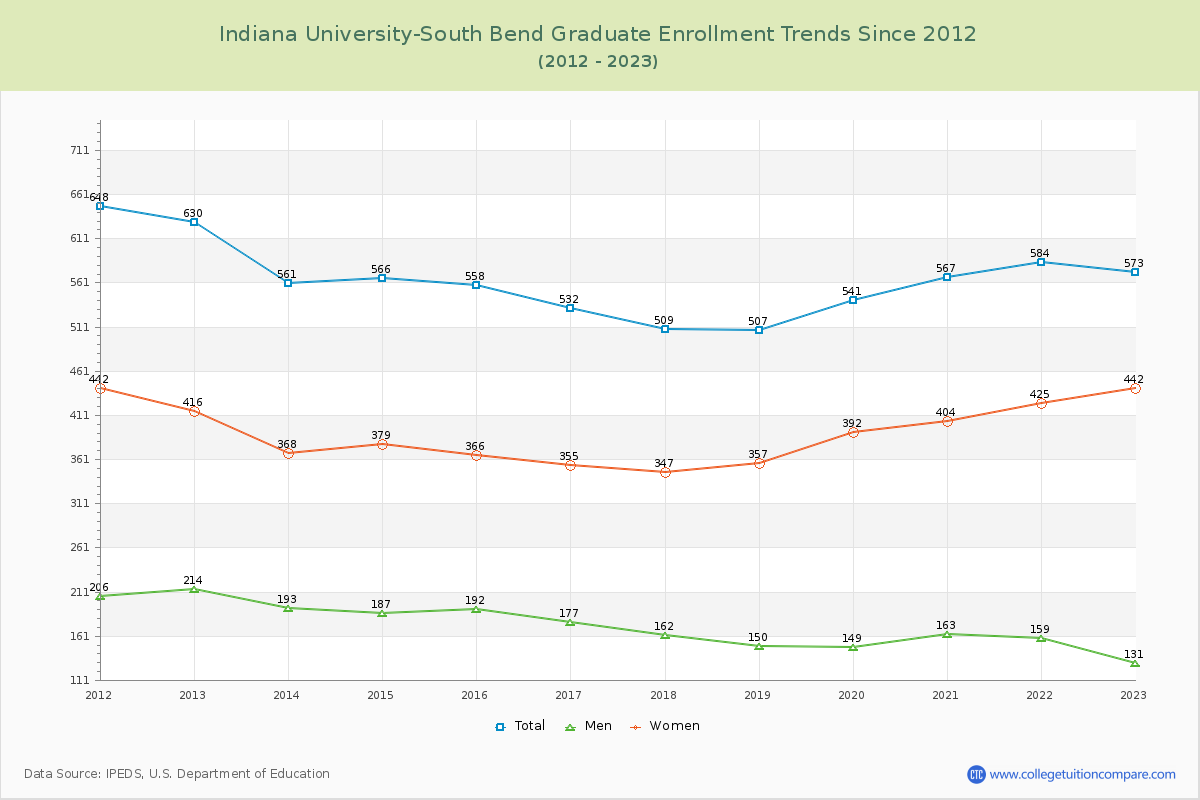
86.75% of total students is undergraduate students and 13.25% students is graduate students. The number of undergraduate students has decreased by 4,107 and the graduate enrollment has decreased by 57 over past 10 years.
The female to male ratio is 2.00 to 1 and it means that there are more female students enrolled in IUSB than male students.
The following table and chart illustrate the changes in student population by gender at Indiana University-South Bend since 2012.
| Year | Total | Undergraduate | Graduate | ||||
|---|---|---|---|---|---|---|---|
| Total | Men | Women | Total | Men | Women | ||
| 2012-13 | 8,490 | 7,860 | 3,012 | 4,848 | 630 | 214 | 416 |
| 2013-14 | 8,073 -417 | 7,512 -348 | 2,945 -67 | 4,567 -281 | 561 -69 | 193 -21 | 368 -48 |
| 2014-15 | 7,859 -214 | 7,293 -219 | 2,817 -128 | 4,476 -91 | 566 5 | 187 -6 | 379 11 |
| 2015-16 | 7,574 -285 | 7,016 -277 | 2,768 -49 | 4,248 -228 | 558 -8 | 192 5 | 366 -13 |
| 2016-17 | 7,185 -389 | 6,653 -363 | 2,626 -142 | 4,027 -221 | 532 -26 | 177 -15 | 355 -11 |
| 2017-18 | 5,385 -1,800 | 4,876 -1,777 | 1,862 -764 | 3,014 -1,013 | 509 -23 | 162 -15 | 347 -8 |
| 2018-19 | 5,214 -171 | 4,707 -169 | 1,727 -135 | 2,980 -34 | 507 -2 | 150 -12 | 357 10 |
| 2019-20 | 5,092 -122 | 4,551 -156 | 1,643 -84 | 2,908 -72 | 541 34 | 149 -1 | 392 35 |
| 2020-21 | 4,942 -150 | 4,375 -176 | 1,550 -93 | 2,825 -83 | 567 26 | 163 14 | 404 12 |
| 2021-22 | 4,449 -493 | 3,865 -510 | 1,366 -184 | 2,499 -326 | 584 17 | 159 -4 | 425 21 |
| 2022-23 | 4,326 -123 | 3,753 -112 | 1,312 -54 | 2,441 -58 | 573 -11 | 131 -28 | 442 17 |
| Average | 6,235 | 5,678 | 2,148 | 3,530 | 557 | 171 | 386 |