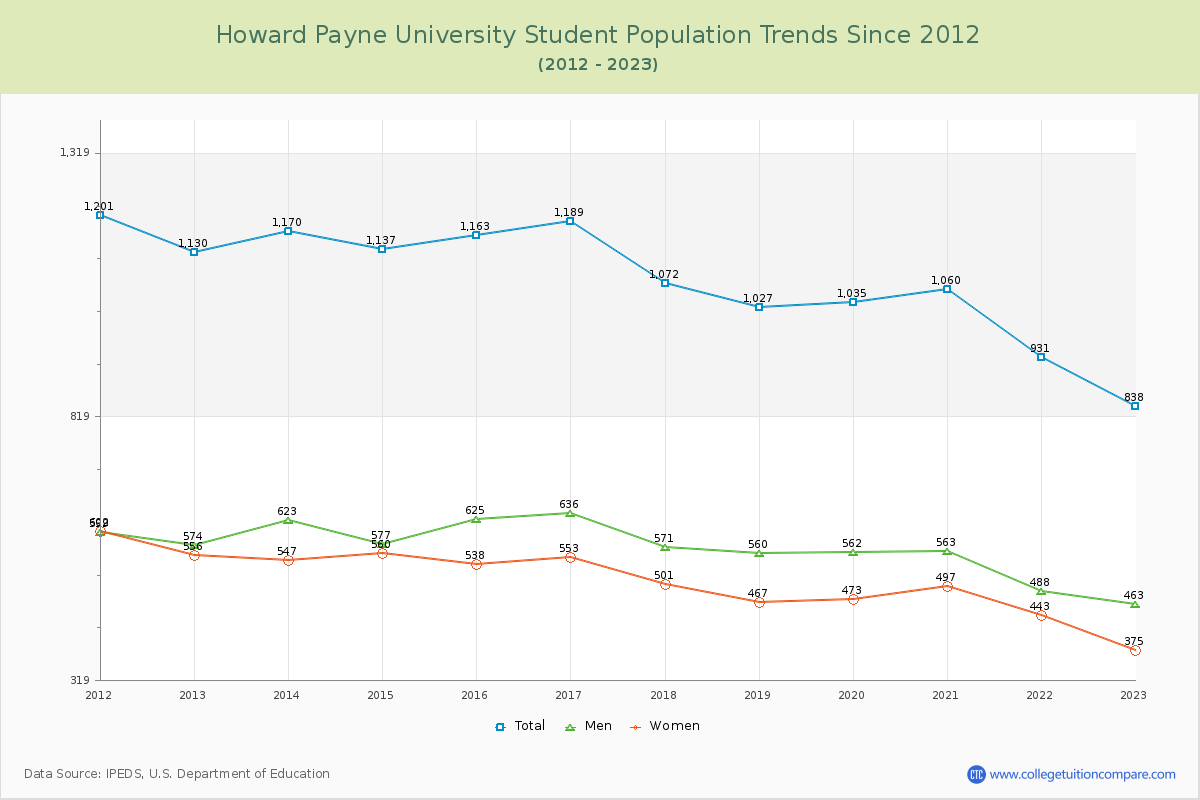
Student Population Changes
The average student population over the last 12 years is 1,068 where 838 students are attending the school for the academic year 2022-2023.
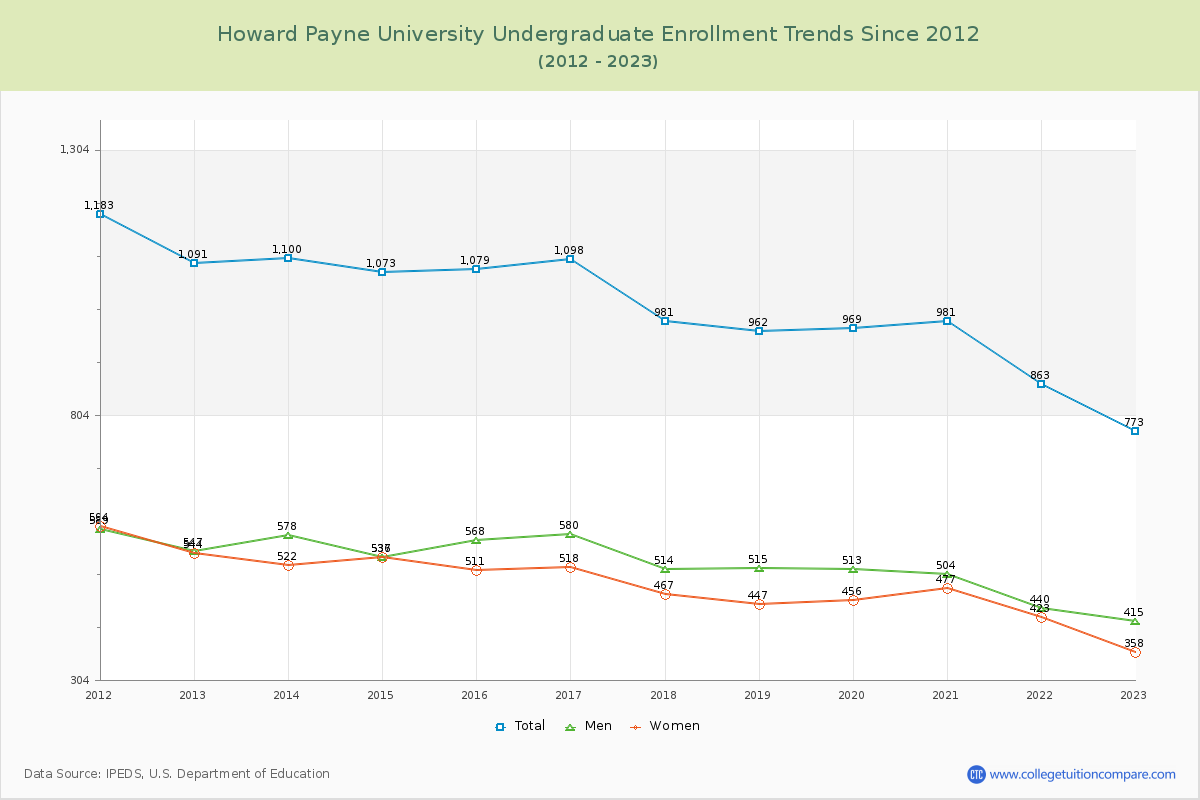
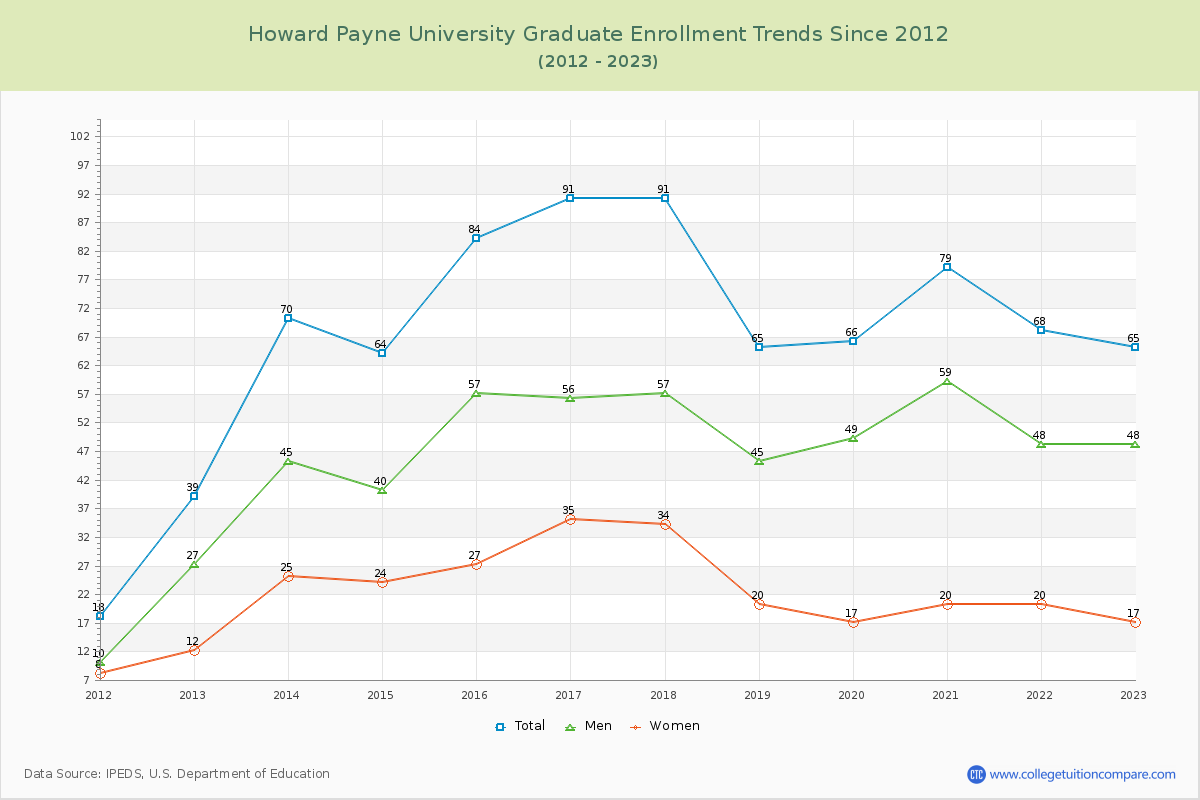
92.24% of total students is undergraduate students and 7.76% students is graduate students. The number of undergraduate students has decreased by 318 and the graduate enrollment has increased by 26 over past 10 years.
The female to male ratio is 0.81 to 1 and it means that there are slightly more male students enrolled in Howard Payne than female students.
The following table and chart illustrate the changes in student population by gender at Howard Payne University since 2012.
| Year | Total | Undergraduate | Graduate | ||||
|---|---|---|---|---|---|---|---|
| Total | Men | Women | Total | Men | Women | ||
| 2012-13 | 1,130 | 1,091 | 547 | 544 | 39 | 27 | 12 |
| 2013-14 | 1,170 40 | 1,100 9 | 578 31 | 522 -22 | 70 31 | 45 18 | 25 13 |
| 2014-15 | 1,137 -33 | 1,073 -27 | 537 -41 | 536 14 | 64 -6 | 40 -5 | 24 -1 |
| 2015-16 | 1,163 26 | 1,079 6 | 568 31 | 511 -25 | 84 20 | 57 17 | 27 3 |
| 2016-17 | 1,189 26 | 1,098 19 | 580 12 | 518 7 | 91 7 | 56 -1 | 35 8 |
| 2017-18 | 1,072 -117 | 981 -117 | 514 -66 | 467 -51 | 91 0 | 57 1 | 34 -1 |
| 2018-19 | 1,027 -45 | 962 -19 | 515 1 | 447 -20 | 65 -26 | 45 -12 | 20 -14 |
| 2019-20 | 1,035 8 | 969 7 | 513 -2 | 456 9 | 66 1 | 49 4 | 17 -3 |
| 2020-21 | 1,060 25 | 981 12 | 504 -9 | 477 21 | 79 13 | 59 10 | 20 3 |
| 2021-22 | 931 -129 | 863 -118 | 440 -64 | 423 -54 | 68 -11 | 48 -11 | 20 0 |
| 2022-23 | 838 -93 | 773 -90 | 415 -25 | 358 -65 | 65 -3 | 48 0 | 17 -3 |
| Average | 1,068 | 997 | 519 | 478 | 71 | 48 | 23 |