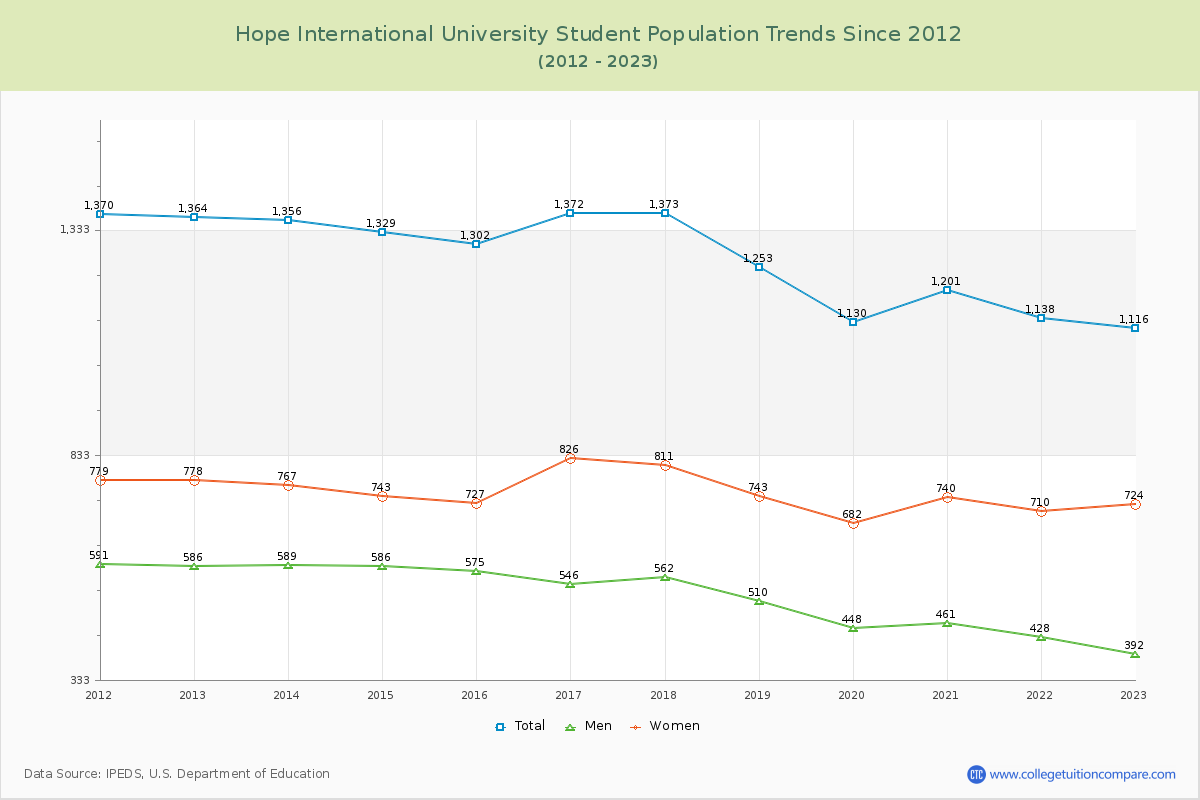
Student Population Changes
The average student population over the last 12 years is 1,267 where 1,116 students are attending the school for the academic year 2022-2023.
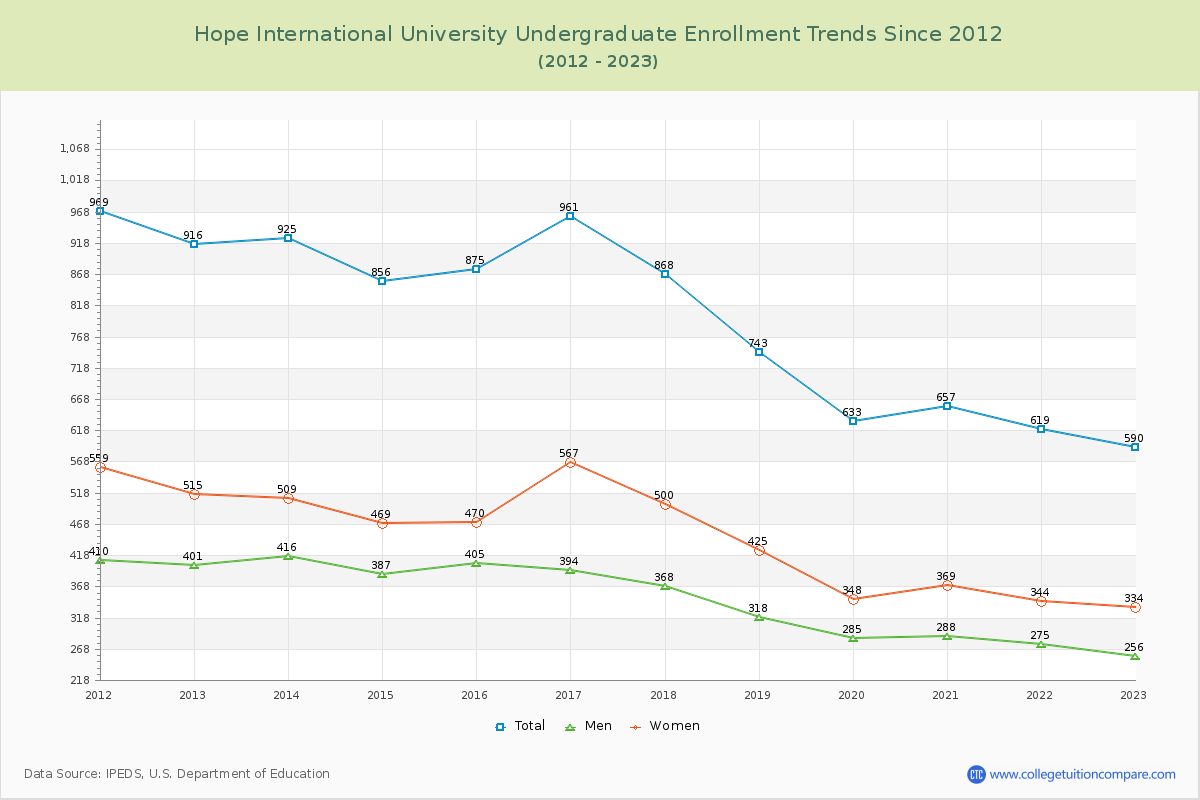
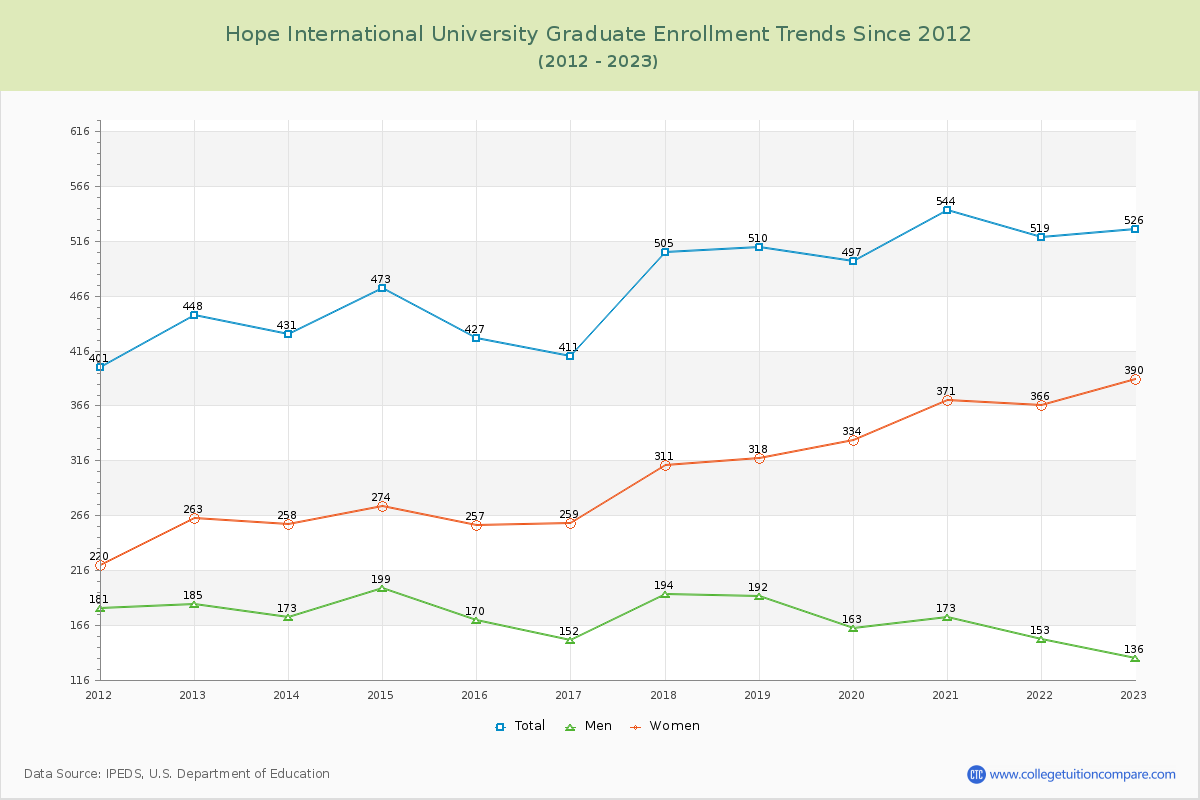
52.87% of total students is undergraduate students and 47.13% students is graduate students. The number of undergraduate students has decreased by 326 and the graduate enrollment has increased by 78 over past 10 years.
The female to male ratio is 1.85 to 1 and it means that there are more female students enrolled in HIU than male students.
The following table and chart illustrate the changes in student population by gender at Hope International University since 2012.
| Year | Total | Undergraduate | Graduate | ||||
|---|---|---|---|---|---|---|---|
| Total | Men | Women | Total | Men | Women | ||
| 2012-13 | 1,364 | 916 | 401 | 515 | 448 | 185 | 263 |
| 2013-14 | 1,356 -8 | 925 9 | 416 15 | 509 -6 | 431 -17 | 173 -12 | 258 -5 |
| 2014-15 | 1,329 -27 | 856 -69 | 387 -29 | 469 -40 | 473 42 | 199 26 | 274 16 |
| 2015-16 | 1,302 -27 | 875 19 | 405 18 | 470 1 | 427 -46 | 170 -29 | 257 -17 |
| 2016-17 | 1,372 70 | 961 86 | 394 -11 | 567 97 | 411 -16 | 152 -18 | 259 2 |
| 2017-18 | 1,373 1 | 868 -93 | 368 -26 | 500 -67 | 505 94 | 194 42 | 311 52 |
| 2018-19 | 1,253 -120 | 743 -125 | 318 -50 | 425 -75 | 510 5 | 192 -2 | 318 7 |
| 2019-20 | 1,130 -123 | 633 -110 | 285 -33 | 348 -77 | 497 -13 | 163 -29 | 334 16 |
| 2020-21 | 1,201 71 | 657 24 | 288 3 | 369 21 | 544 47 | 173 10 | 371 37 |
| 2021-22 | 1,138 -63 | 619 -38 | 275 -13 | 344 -25 | 519 -25 | 153 -20 | 366 -5 |
| 2022-23 | 1,116 -22 | 590 -29 | 256 -19 | 334 -10 | 526 7 | 136 -17 | 390 24 |
| Average | 1,267 | 786 | 345 | 441 | 481 | 172 | 309 |