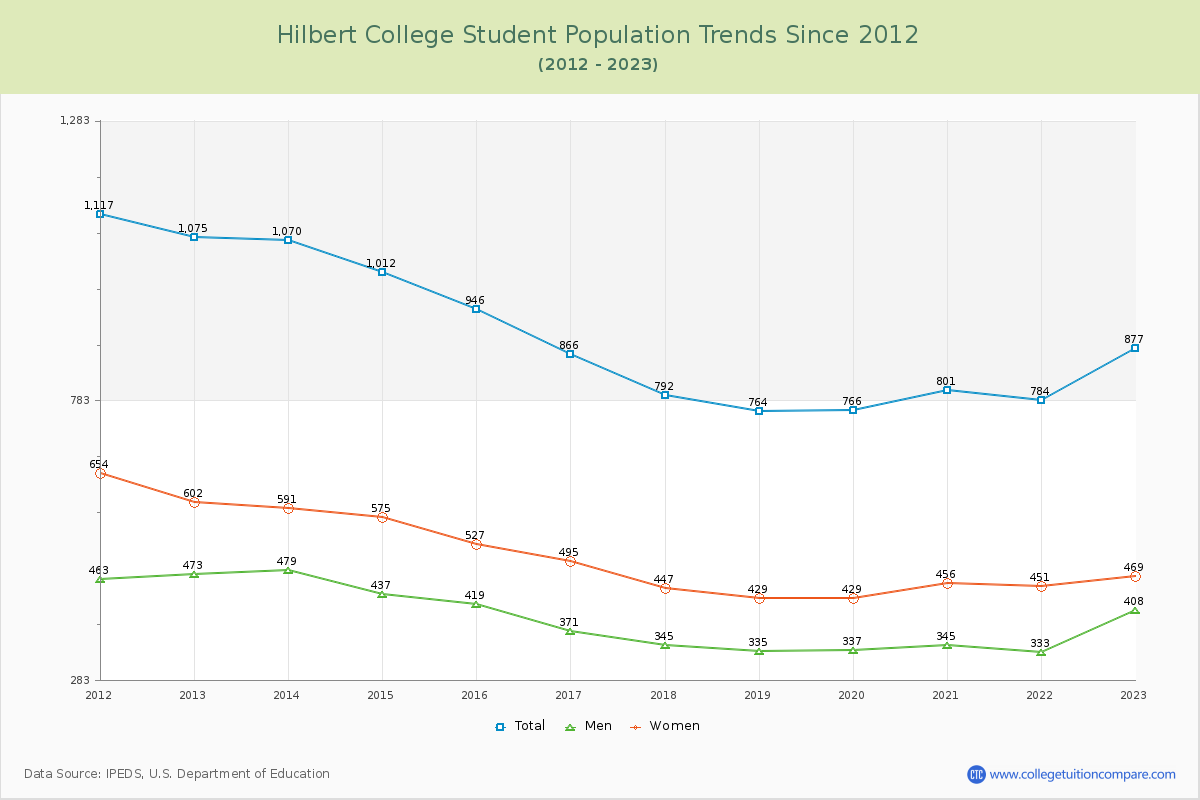
Student Population Changes
The average student population over the last 12 years is 887 where 877 students are attending the school for the academic year 2022-2023.
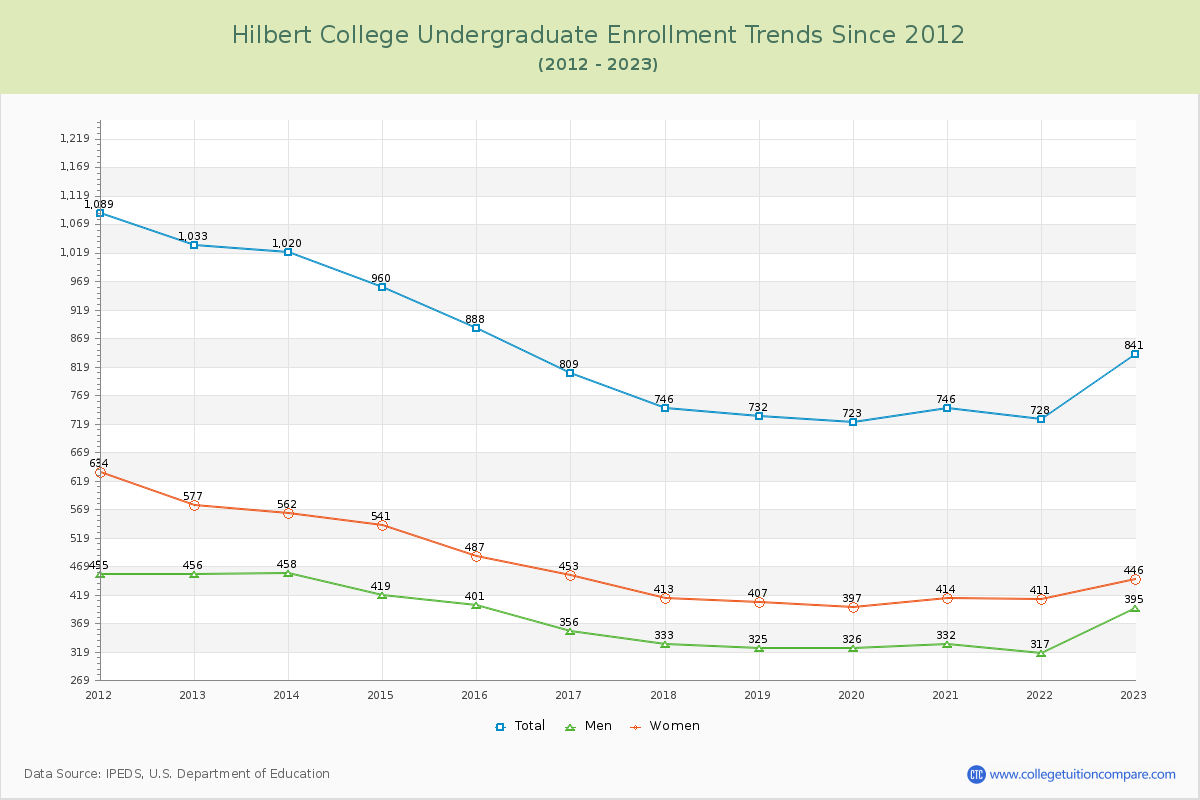
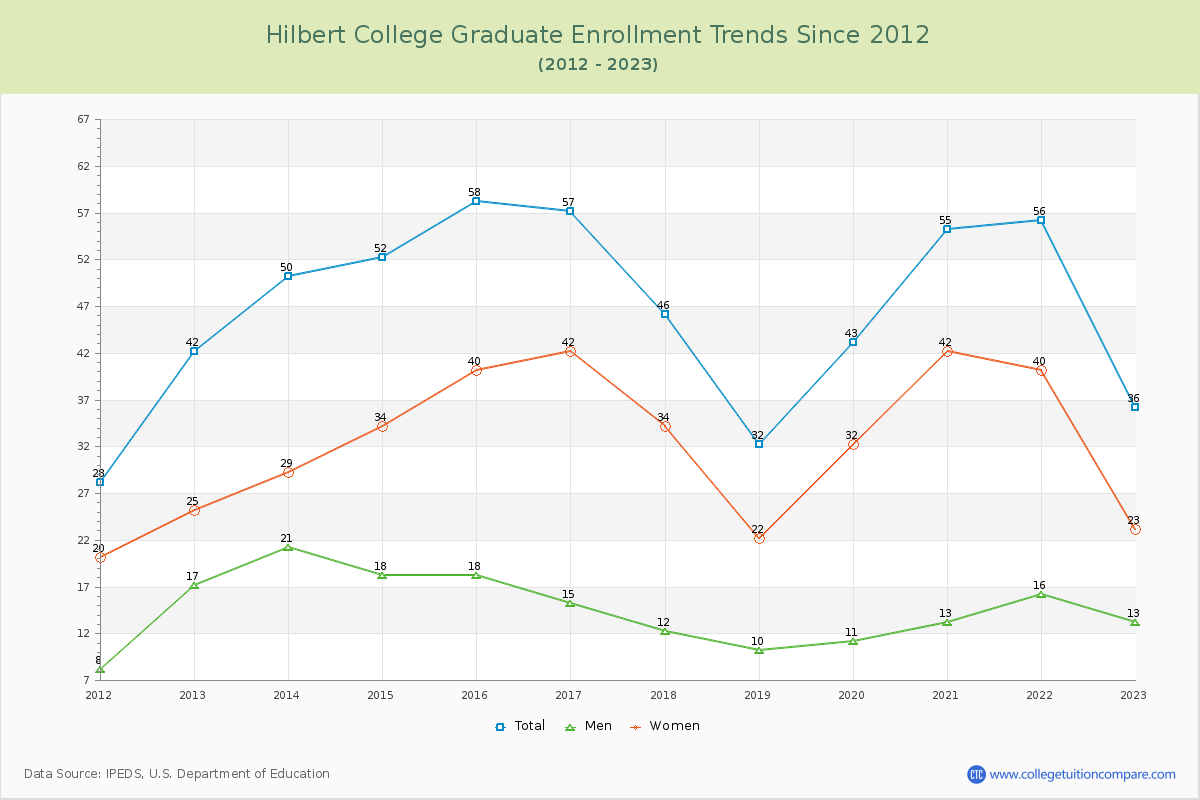
95.90% of total students is undergraduate students and 4.10% students is graduate students. The number of undergraduate students has decreased by 192 and the graduate enrollment has decreased by 6 over past 10 years.
The female to male ratio is 1.15 to 1 and it means that there are slightly more female students enrolled in Hilbert than male students.
The following table and chart illustrate the changes in student population by gender at Hilbert College since 2012.
| Year | Total | Undergraduate | Graduate | ||||
|---|---|---|---|---|---|---|---|
| Total | Men | Women | Total | Men | Women | ||
| 2012-13 | 1,075 | 1,033 | 456 | 577 | 42 | 17 | 25 |
| 2013-14 | 1,070 -5 | 1,020 -13 | 458 2 | 562 -15 | 50 8 | 21 4 | 29 4 |
| 2014-15 | 1,012 -58 | 960 -60 | 419 -39 | 541 -21 | 52 2 | 18 -3 | 34 5 |
| 2015-16 | 946 -66 | 888 -72 | 401 -18 | 487 -54 | 58 6 | 18 0 | 40 6 |
| 2016-17 | 866 -80 | 809 -79 | 356 -45 | 453 -34 | 57 -1 | 15 -3 | 42 2 |
| 2017-18 | 792 -74 | 746 -63 | 333 -23 | 413 -40 | 46 -11 | 12 -3 | 34 -8 |
| 2018-19 | 764 -28 | 732 -14 | 325 -8 | 407 -6 | 32 -14 | 10 -2 | 22 -12 |
| 2019-20 | 766 2 | 723 -9 | 326 1 | 397 -10 | 43 11 | 11 1 | 32 10 |
| 2020-21 | 801 35 | 746 23 | 332 6 | 414 17 | 55 12 | 13 2 | 42 10 |
| 2021-22 | 784 -17 | 728 -18 | 317 -15 | 411 -3 | 56 1 | 16 3 | 40 -2 |
| 2022-23 | 877 93 | 841 113 | 395 78 | 446 35 | 36 -20 | 13 -3 | 23 -17 |
| Average | 887 | 839 | 374 | 464 | 48 | 15 | 33 |