Student Population by Gender
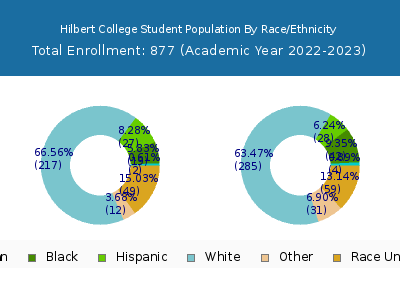
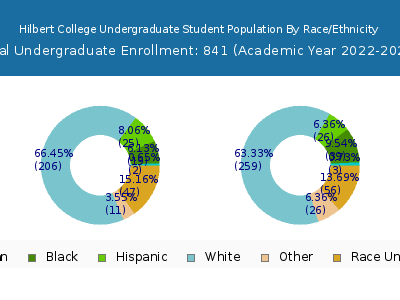
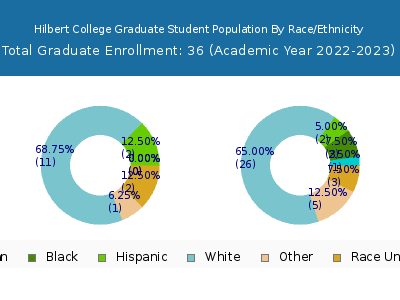
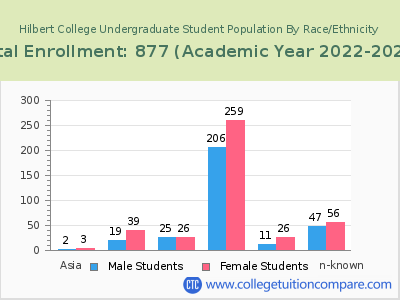
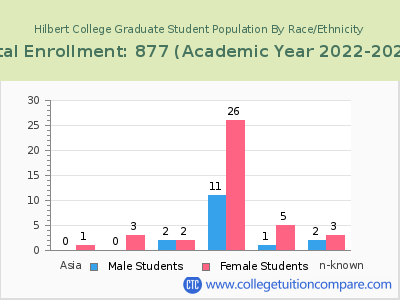
Hilbert College has a total of 877 enrolled students for the academic year 2022-2023. 841 students have enrolled in undergraduate programs and 36 students joined graduate programs.
By gender, 408 male and 469 female students (the male-female ratio is 47:53) are attending the school. The gender distribution is based on the 2022-2023 data.
| Total | Undergraduate | Graduate | |
|---|---|---|---|
| Total | 877 | 841 | 36 |
| Men | 408 | 395 | 13 |
| Women | 469 | 446 | 23 |
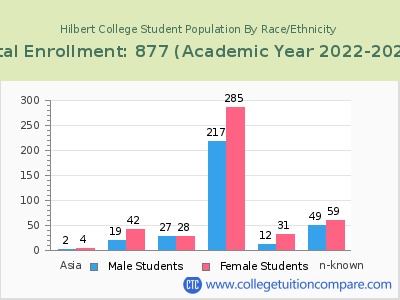
Student Distribution by Race/Ethnicity
| Race | Total | Men | Women |
|---|---|---|---|
| American Indian or Native American | 7 | 6 | 1 |
| Asian | 8 | 3 | 5 |
| Black | 90 | 53 | 37 |
| Hispanic | 37 | 16 | 21 |
| Native Hawaiian or Other Pacific Islanders | 0 | 0 | 0 |
| White | 494 | 215 | 279 |
| Two or more races | 33 | 12 | 21 |
| Race Unknown | 193 | 97 | 96 |
| Race | Total | Men | Women |
|---|---|---|---|
| American Indian or Native American | 6 | 5 | 1 |
| Asian | 8 | 3 | 5 |
| Black | 88 | 53 | 35 |
| Hispanic | 36 | 16 | 20 |
| Native Hawaiian or Other Pacific Islanders | 0 | 0 | 0 |
| White | 473 | 208 | 265 |
| Two or more races | 29 | 11 | 18 |
| Race Unknown | 186 | 93 | 93 |
| Race | Total | Men | Women |
|---|---|---|---|
| American Indian or Native American | 0 | 0 | 0 |
| Asian | 3 | 0 | 3 |
| Black | 8 | 5 | 3 |
| Hispanic | 2 | 0 | 2 |
| Native Hawaiian or Other Pacific Islanders | 0 | 0 | 0 |
| White | 29 | 15 | 14 |
| Two or more races | 0 | 0 | 0 |
| Race Unknown | 37 | 17 | 20 |
Online Student Enrollment
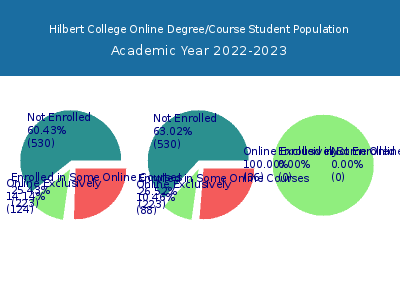
Distance learning, also called online education, is very attractive to students, especially who want to continue education and work in field. At Hilbert College, 124 students are enrolled exclusively in online courses and 223 students are enrolled in some online courses.
115 students lived in New York or jurisdiction in which the school is located are enrolled exclusively in online courses and 9 students live in other State or outside of the United States.
| All Students | Enrolled Exclusively Online Courses | Enrolled in Some Online Courses | |
|---|---|---|---|
| All Students | 877 | 124 | 223 |
| Undergraduate | 841 | 88 | 223 |
| Graduate | 36 | 36 | 0 |
| New York Residents | Other States in U.S. | Outside of U.S. | |
|---|---|---|---|
| All Students | 115 | 9 | 0 |
| Undergraduate | 80 | 8 | 0 |
| Graduate | 35 | 1 | 0 |
Transfer-in Students (Undergraduate)
Among 841 enrolled in undergraduate programs, 85 students have transferred-in from other institutions. The percentage of transfer-in students is 10.11%.79 students have transferred in as full-time status and 6 students transferred in as part-time status.
| Number of Students | |
|---|---|
| Regular Full-time | 720 |
| Transfer-in Full-time | 79 |
| Regular Part-time | 36 |
| Transfer-in Part-time | 6 |
