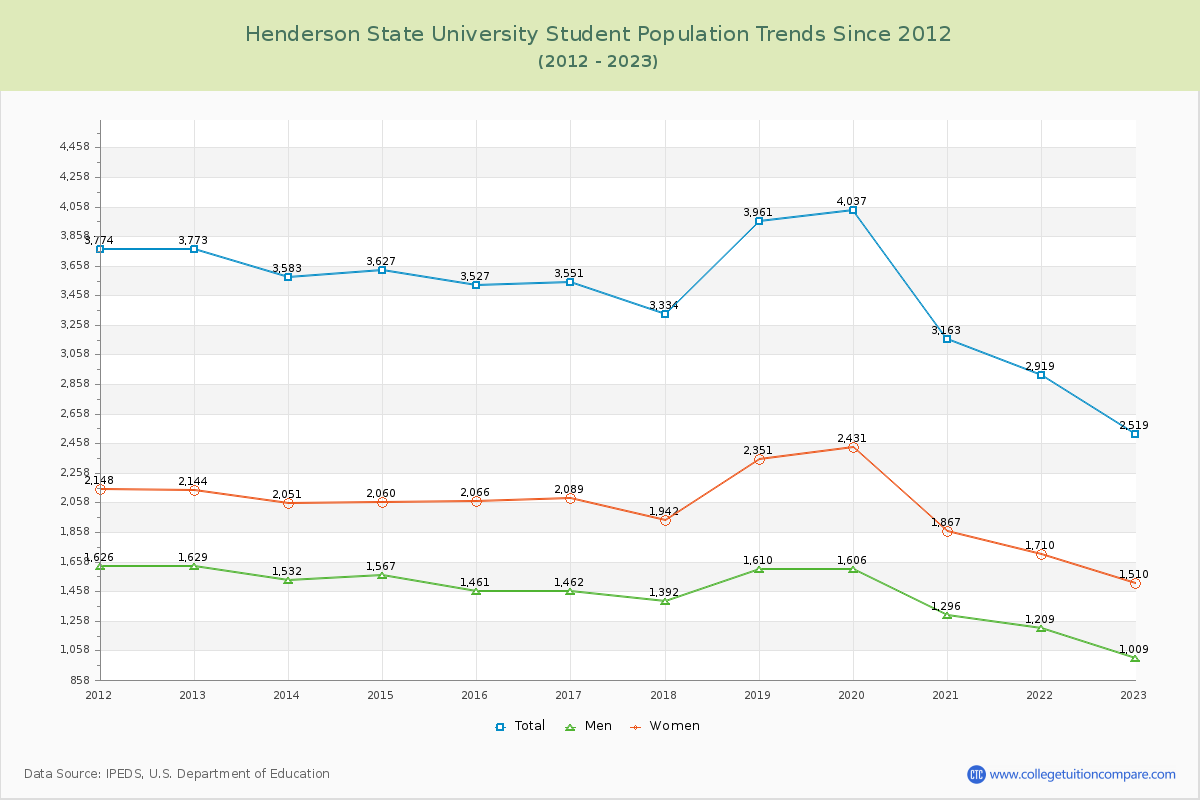
Student Population Changes
The average student population over the last 12 years is 3,454 where 2,519 students are attending the school for the academic year 2022-2023.
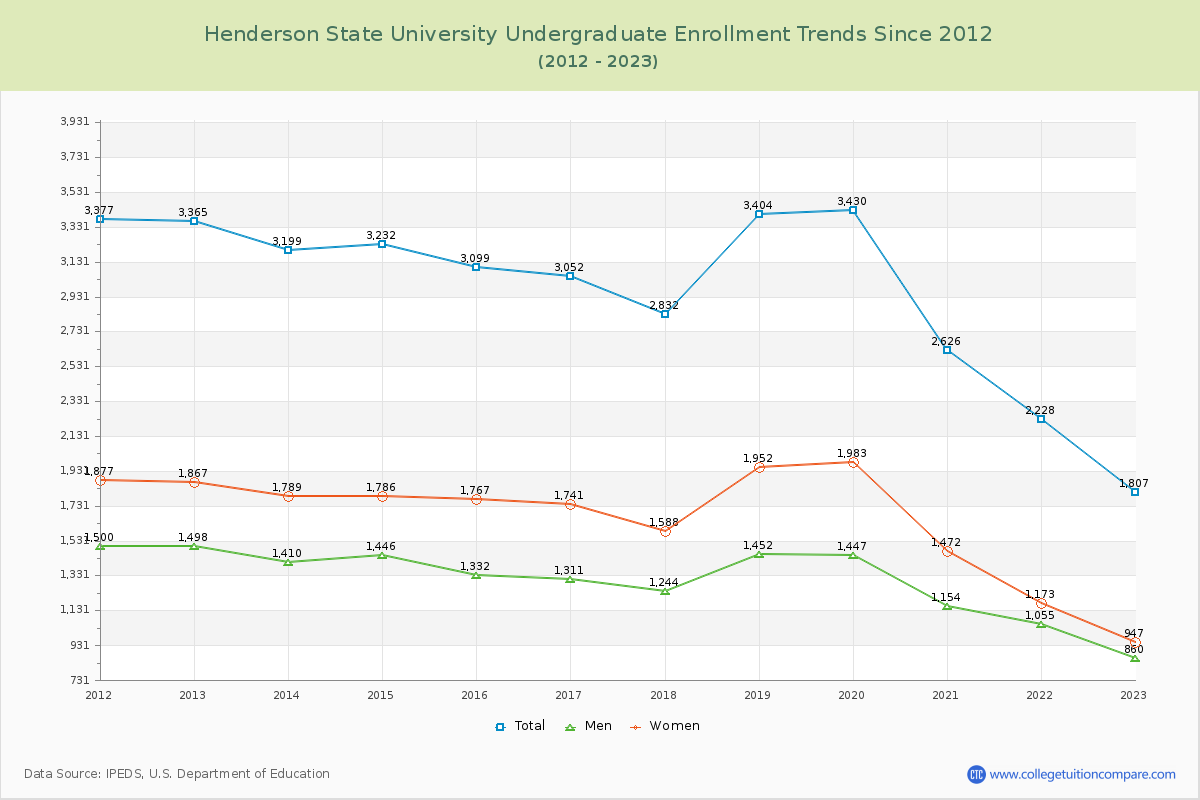
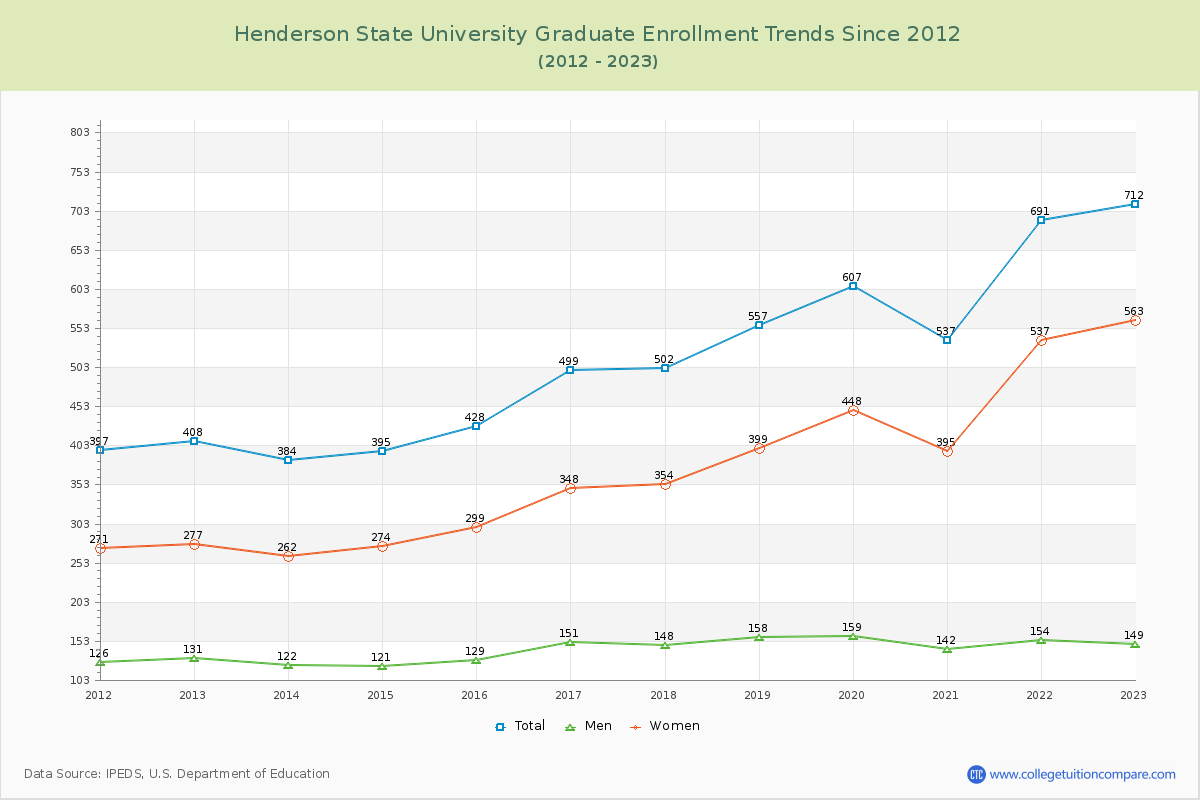
71.73% of total students is undergraduate students and 28.27% students is graduate students. The number of undergraduate students has decreased by 1,558 and the graduate enrollment has increased by 304 over past 10 years.
The female to male ratio is 1.50 to 1 and it means that there are more female students enrolled in Henderson State than male students.
The following table and chart illustrate the changes in student population by gender at Henderson State University since 2012.
| Year | Total | Undergraduate | Graduate | ||||
|---|---|---|---|---|---|---|---|
| Total | Men | Women | Total | Men | Women | ||
| 2012-13 | 3,773 | 3,365 | 1,498 | 1,867 | 408 | 131 | 277 |
| 2013-14 | 3,583 -190 | 3,199 -166 | 1,410 -88 | 1,789 -78 | 384 -24 | 122 -9 | 262 -15 |
| 2014-15 | 3,627 44 | 3,232 33 | 1,446 36 | 1,786 -3 | 395 11 | 121 -1 | 274 12 |
| 2015-16 | 3,527 -100 | 3,099 -133 | 1,332 -114 | 1,767 -19 | 428 33 | 129 8 | 299 25 |
| 2016-17 | 3,551 24 | 3,052 -47 | 1,311 -21 | 1,741 -26 | 499 71 | 151 22 | 348 49 |
| 2017-18 | 3,334 -217 | 2,832 -220 | 1,244 -67 | 1,588 -153 | 502 3 | 148 -3 | 354 6 |
| 2018-19 | 3,961 627 | 3,404 572 | 1,452 208 | 1,952 364 | 557 55 | 158 10 | 399 45 |
| 2019-20 | 4,037 76 | 3,430 26 | 1,447 -5 | 1,983 31 | 607 50 | 159 1 | 448 49 |
| 2020-21 | 3,163 -874 | 2,626 -804 | 1,154 -293 | 1,472 -511 | 537 -70 | 142 -17 | 395 -53 |
| 2021-22 | 2,919 -244 | 2,228 -398 | 1,055 -99 | 1,173 -299 | 691 154 | 154 12 | 537 142 |
| 2022-23 | 2,519 -400 | 1,807 -421 | 860 -195 | 947 -226 | 712 21 | 149 -5 | 563 26 |
| Average | 3,454 | 2,934 | 1,292 | 1,642 | 520 | 142 | 378 |