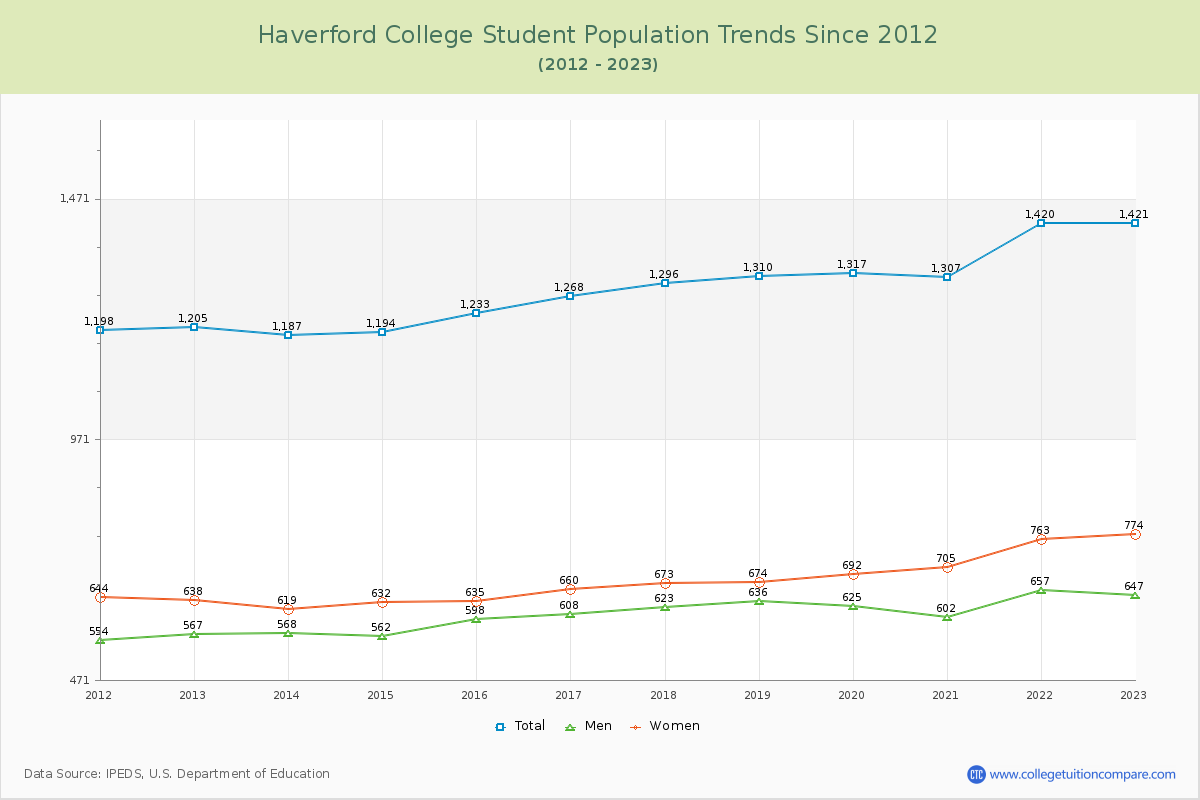
Student Population Changes
The average student population over the last 12 years is 1,287 where 1,421 students are attending the school for the academic year 2022-2023.
The female to male ratio is 1.20 to 1 and it means that there are slightly more female students enrolled in Haverford than male students.
The following table and chart illustrate the changes in student population by gender at Haverford College since 2012.
| Year | Total | Men | Women |
|---|---|---|---|
| 2012-13 | 1,205 | 567 | 638 |
| 2013-14 | 1,187 -18 | 568 1 | 619 -19 |
| 2014-15 | 1,194 7 | 562 -6 | 632 13 |
| 2015-16 | 1,233 39 | 598 36 | 635 3 |
| 2016-17 | 1,268 35 | 608 10 | 660 25 |
| 2017-18 | 1,296 28 | 623 15 | 673 13 |
| 2018-19 | 1,310 14 | 636 13 | 674 1 |
| 2019-20 | 1,317 7 | 625 -11 | 692 18 |
| 2020-21 | 1,307 -10 | 602 -23 | 705 13 |
| 2021-22 | 1,420 113 | 657 55 | 763 58 |
| 2022-23 | 1,421 1 | 647 -10 | 774 11 |
| Average | 1,287 | 608 | 679 |