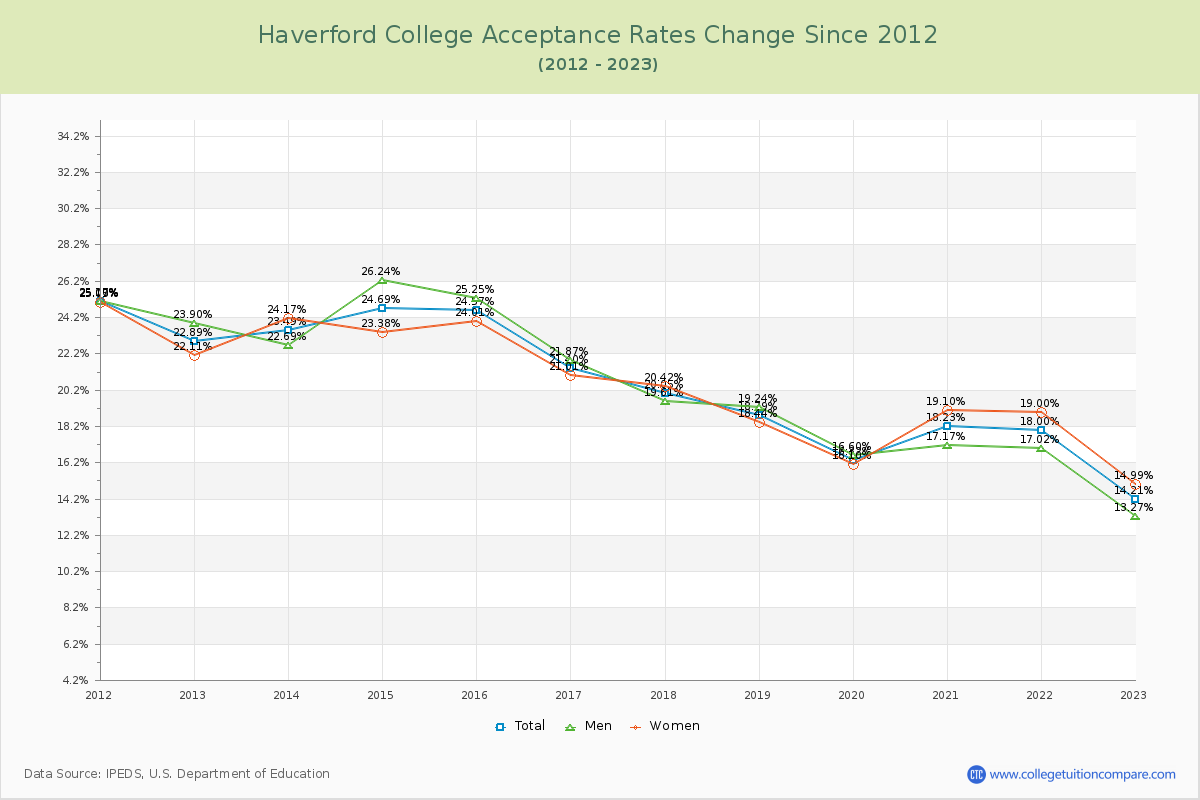
Acceptance Rate Changes
The average acceptance rate over the last 10 years is 20.24%, and this year's acceptance rate is 14.21% at Haverford College. By gender, men students' acceptance rate is 20.26% and women students' rate is 20.25%. For 2023 admission, it was slightly harder to get into Haverford College than the previous year. Haverford College has beep kept its acceptance rate very low and it is hard that applicants admit into the school.
The next table and chart illustrate the acceptance rates changes at Haverford College over the past 11 years (2012-2023).
| Year | Total | Men | Women |
|---|---|---|---|
| 2012-13 | 22.89% | 23.90% | 22.11% |
| 2013-14 | 23.49% 0.60% |
22.69% 2.06% |
24.17% 2.06% |
| 2014-15 | 24.69% 1.20% |
26.24% -0.79% |
23.38% -0.79% |
| 2015-16 | 24.57% -0.11% |
25.25% 0.63% |
24.01% 0.63% |
| 2016-17 | 21.40% -3.18% |
21.87% -3.00% |
21.01% -3.00% |
| 2017-18 | 20.05% -1.34% |
19.61% -0.59% |
20.42% -0.59% |
| 2018-19 | 18.79% -1.26% |
19.24% -1.99% |
18.44% -1.99% |
| 2019-20 | 16.32% -2.47% |
16.60% -2.34% |
16.10% -2.34% |
| 2020-21 | 18.23% 1.91% |
17.17% 3.00% |
19.10% 3.00% |
| 2021-22 | 18.00% -0.23% |
17.02% -0.10% |
19.00% -0.10% |
| 2022-23 | 14.21% -3.79% |
13.27% -4.00% |
14.99% -4.00% |
| Average | 20.24% | 20.26% | 20.25% |