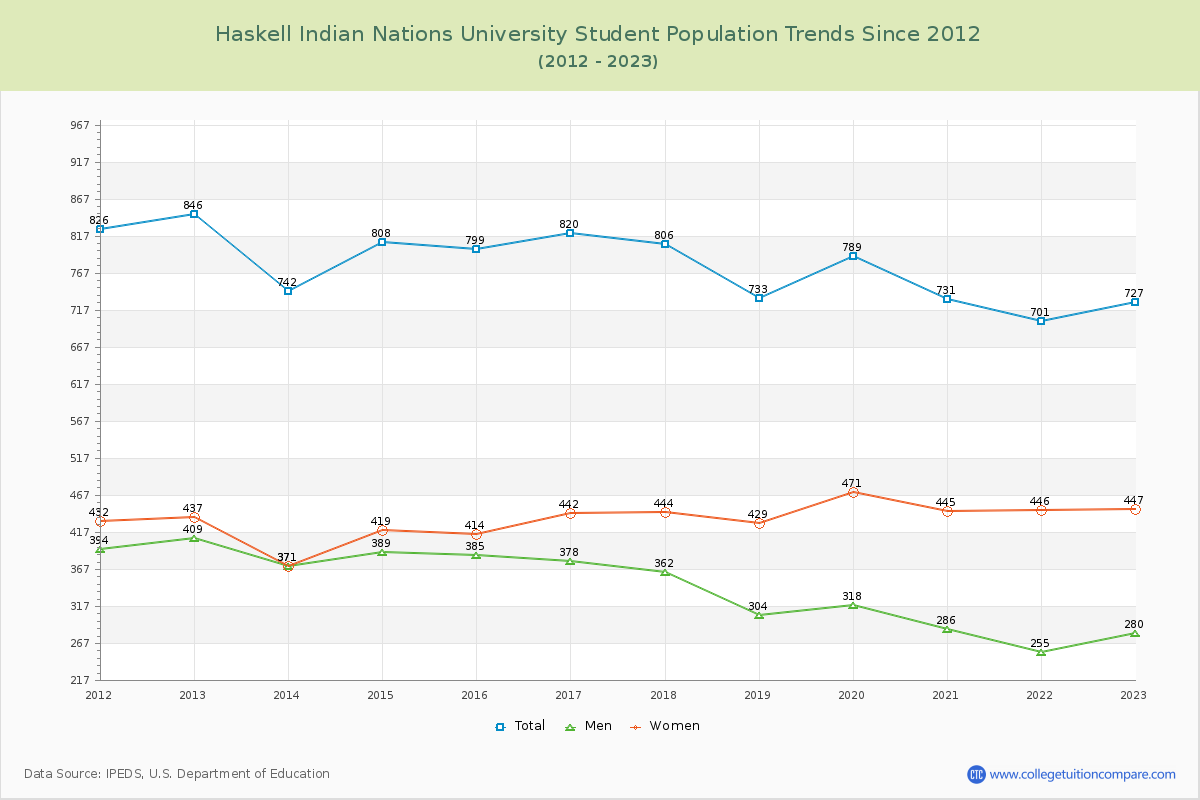
Student Population Changes
The average student population over the last 12 years is 773 where 727 students are attending the school for the academic year 2022-2023.
The female to male ratio is 1.60 to 1 and it means that there are more female students enrolled in Haskell than male students.
The following table and chart illustrate the changes in student population by gender at Haskell Indian Nations University since 2012.
| Year | Total | Men | Women |
|---|---|---|---|
| 2012-13 | 846 | 409 | 437 |
| 2013-14 | 742 -104 | 371 -38 | 371 -66 |
| 2014-15 | 808 66 | 389 18 | 419 48 |
| 2015-16 | 799 -9 | 385 -4 | 414 -5 |
| 2016-17 | 820 21 | 378 -7 | 442 28 |
| 2017-18 | 806 -14 | 362 -16 | 444 2 |
| 2018-19 | 733 -73 | 304 -58 | 429 -15 |
| 2019-20 | 789 56 | 318 14 | 471 42 |
| 2020-21 | 731 -58 | 286 -32 | 445 -26 |
| 2021-22 | 701 -30 | 255 -31 | 446 1 |
| 2022-23 | 727 26 | 280 25 | 447 1 |
| Average | 773 | 340 | 433 |