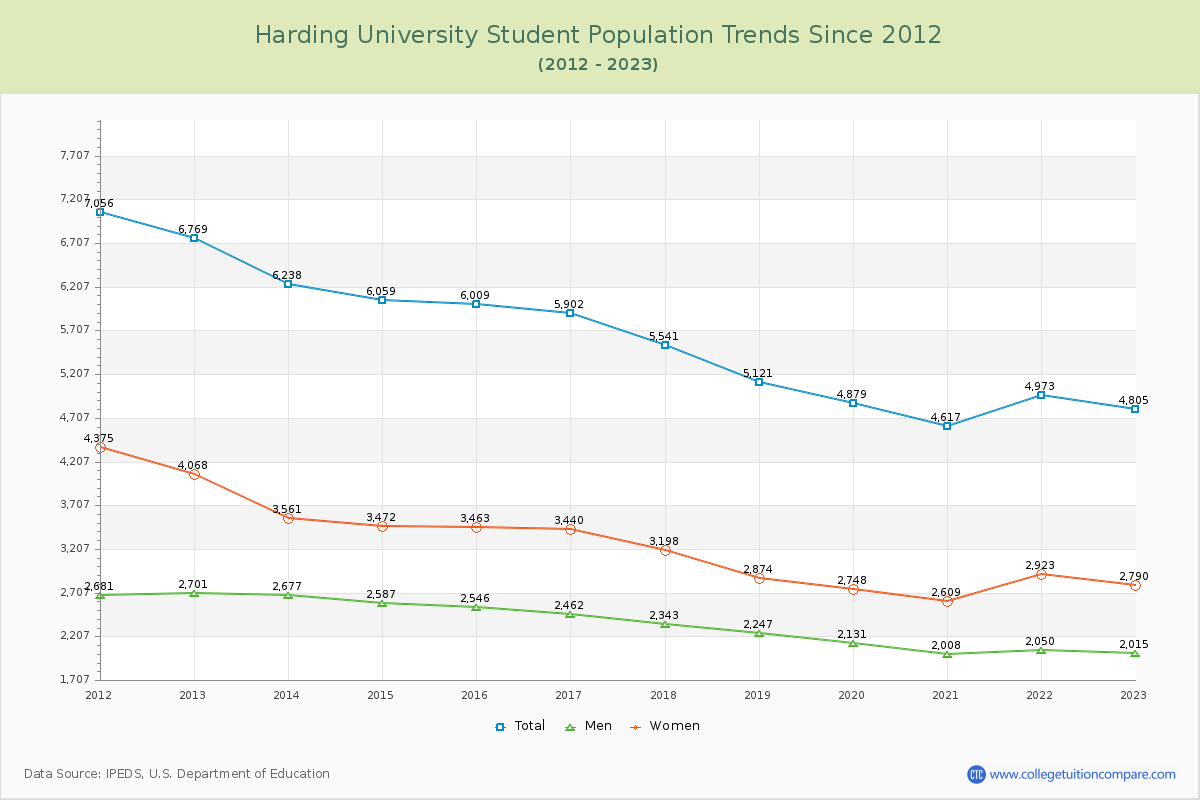
Student Population Changes
The average student population over the last 12 years is 5,538 where 4,805 students are attending the school for the academic year 2022-2023.
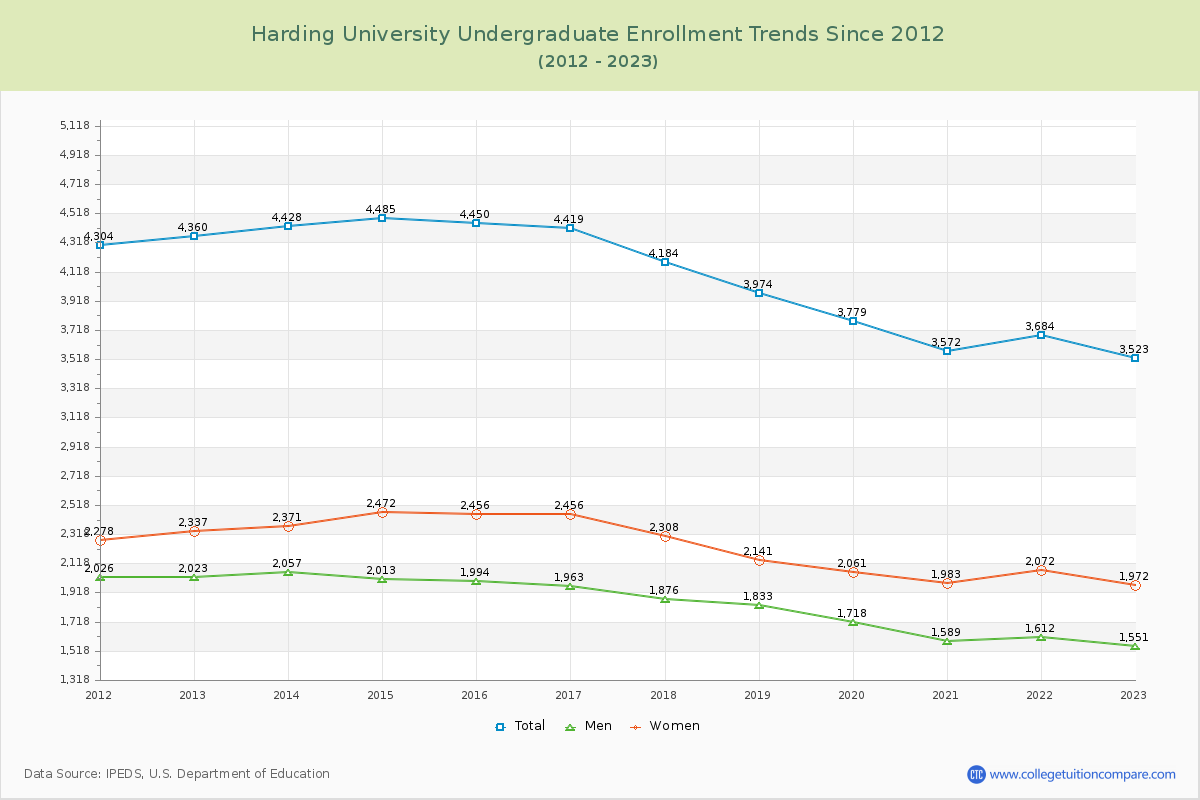
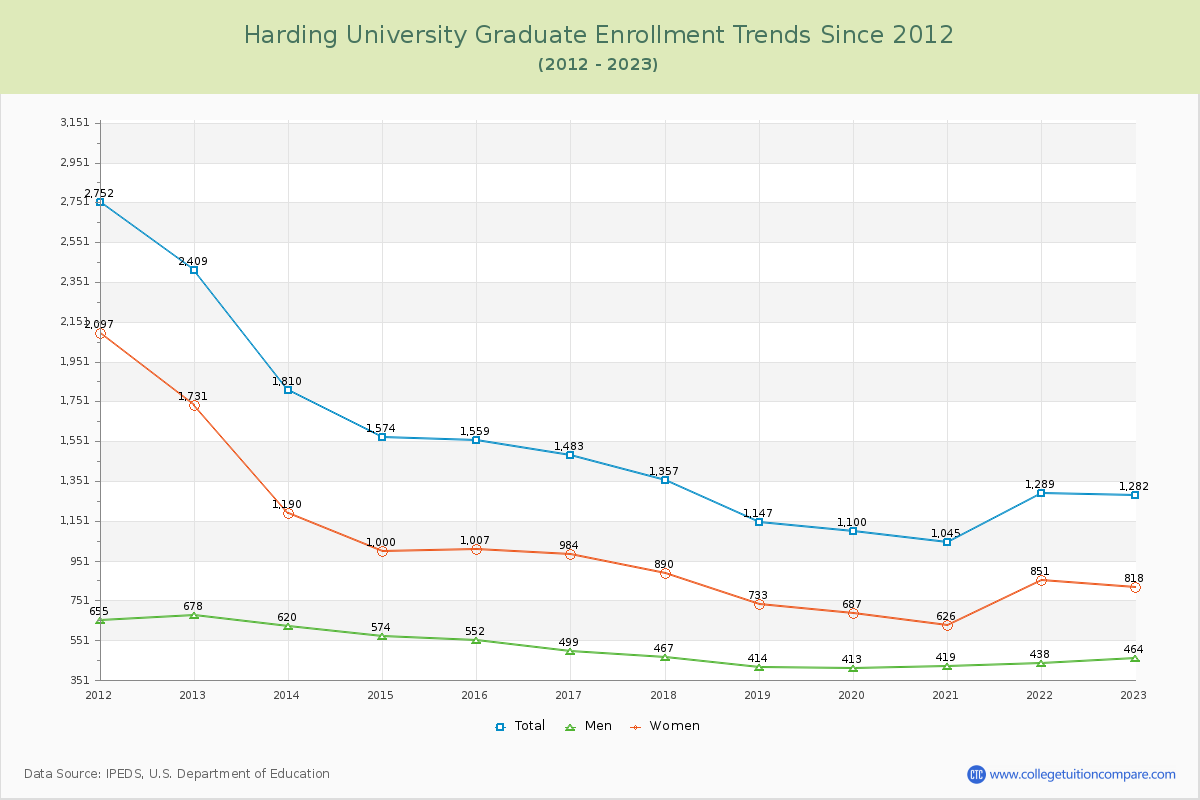
73.32% of total students is undergraduate students and 26.68% students is graduate students. The number of undergraduate students has decreased by 837 and the graduate enrollment has decreased by 1,127 over past 10 years.
The female to male ratio is 1.38 to 1 and it means that there are more female students enrolled in Harding than male students.
The following table and chart illustrate the changes in student population by gender at Harding University since 2012.
| Year | Total | Undergraduate | Graduate | ||||
|---|---|---|---|---|---|---|---|
| Total | Men | Women | Total | Men | Women | ||
| 2012-13 | 6,769 | 4,360 | 2,023 | 2,337 | 2,409 | 678 | 1,731 |
| 2013-14 | 6,238 -531 | 4,428 68 | 2,057 34 | 2,371 34 | 1,810 -599 | 620 -58 | 1,190 -541 |
| 2014-15 | 6,059 -179 | 4,485 57 | 2,013 -44 | 2,472 101 | 1,574 -236 | 574 -46 | 1,000 -190 |
| 2015-16 | 6,009 -50 | 4,450 -35 | 1,994 -19 | 2,456 -16 | 1,559 -15 | 552 -22 | 1,007 7 |
| 2016-17 | 5,902 -107 | 4,419 -31 | 1,963 -31 | 2,456 0 | 1,483 -76 | 499 -53 | 984 -23 |
| 2017-18 | 5,541 -361 | 4,184 -235 | 1,876 -87 | 2,308 -148 | 1,357 -126 | 467 -32 | 890 -94 |
| 2018-19 | 5,121 -420 | 3,974 -210 | 1,833 -43 | 2,141 -167 | 1,147 -210 | 414 -53 | 733 -157 |
| 2019-20 | 4,879 -242 | 3,779 -195 | 1,718 -115 | 2,061 -80 | 1,100 -47 | 413 -1 | 687 -46 |
| 2020-21 | 4,617 -262 | 3,572 -207 | 1,589 -129 | 1,983 -78 | 1,045 -55 | 419 6 | 626 -61 |
| 2021-22 | 4,973 356 | 3,684 112 | 1,612 23 | 2,072 89 | 1,289 244 | 438 19 | 851 225 |
| 2022-23 | 4,805 -168 | 3,523 -161 | 1,551 -61 | 1,972 -100 | 1,282 -7 | 464 26 | 818 -33 |
| Average | 5,538 | 4,078 | 1,839 | 2,239 | 1,460 | 503 | 956 |