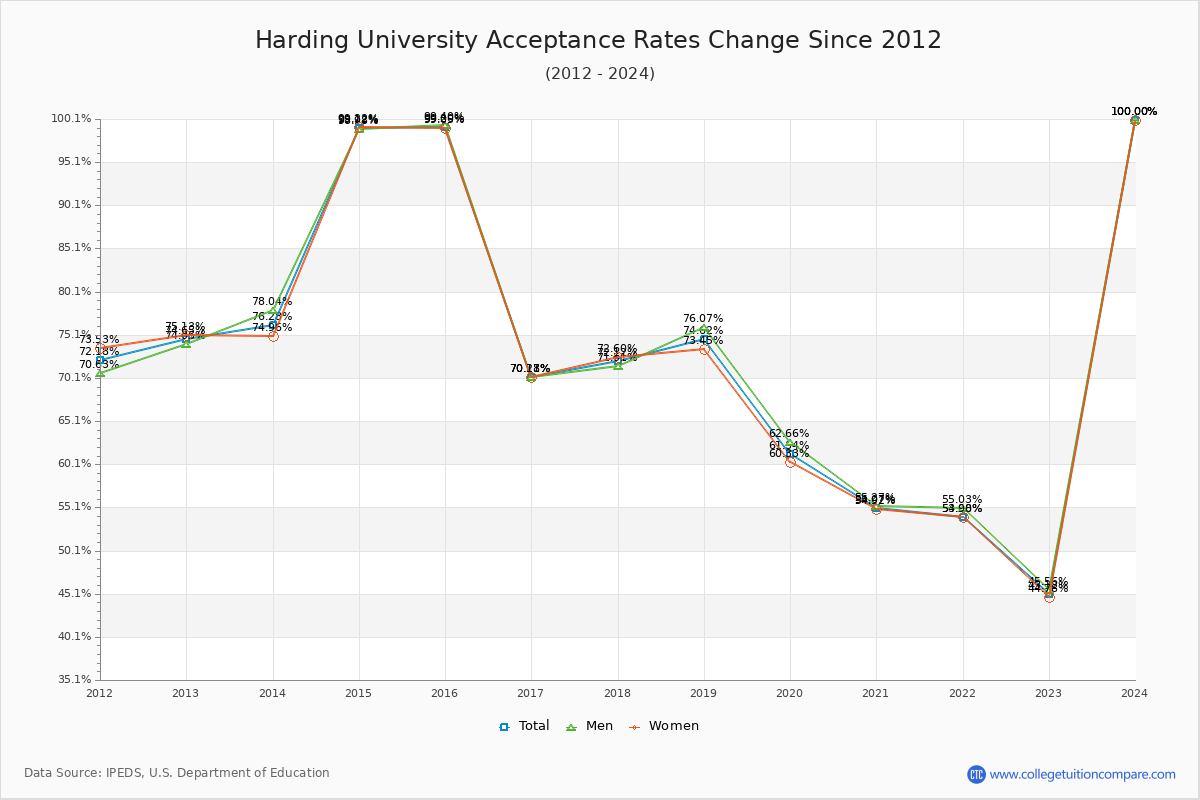
Acceptance Rate Changes
The average acceptance rate over the last 10 years is 71.06%, and this year's acceptance rate is 45.12% at Harding University. By gender, men students' acceptance rate is 71.53% and women students' rate is 70.78%. For 2023 admission, it was slightly harder to get into Harding University than the previous year. The acceptance rate at Harding University have not been tight and applicants have more chance to admit.
The next table and chart illustrate the acceptance rates changes at Harding University over the past 11 years (2012-2023).
| Year | Total | Men | Women |
|---|---|---|---|
| 2012-13 | 74.65% | 74.05% | 75.13% |
| 2013-14 | 76.28% 1.64% |
78.04% -0.17% |
74.96% -0.17% |
| 2014-15 | 99.12% 22.83% |
98.98% 24.26% |
99.22% 24.26% |
| 2015-16 | 99.20% 0.08% |
99.40% -0.17% |
99.05% -0.17% |
| 2016-17 | 70.18% -29.02% |
70.21% -28.88% |
70.17% -28.88% |
| 2017-18 | 72.12% 1.94% |
71.51% 2.43% |
72.60% 2.43% |
| 2018-19 | 74.62% 2.50% |
76.07% 0.85% |
73.45% 0.85% |
| 2019-20 | 61.34% -13.28% |
62.66% -13.12% |
60.33% -13.12% |
| 2020-21 | 55.07% -6.28% |
55.27% -5.41% |
54.92% -5.41% |
| 2021-22 | 54.00% -1.07% |
55.03% -0.94% |
53.98% -0.94% |
| 2022-23 | 45.12% -8.88% |
45.56% -9.20% |
44.78% -9.20% |
| Average | 71.06% | 71.53% | 70.78% |