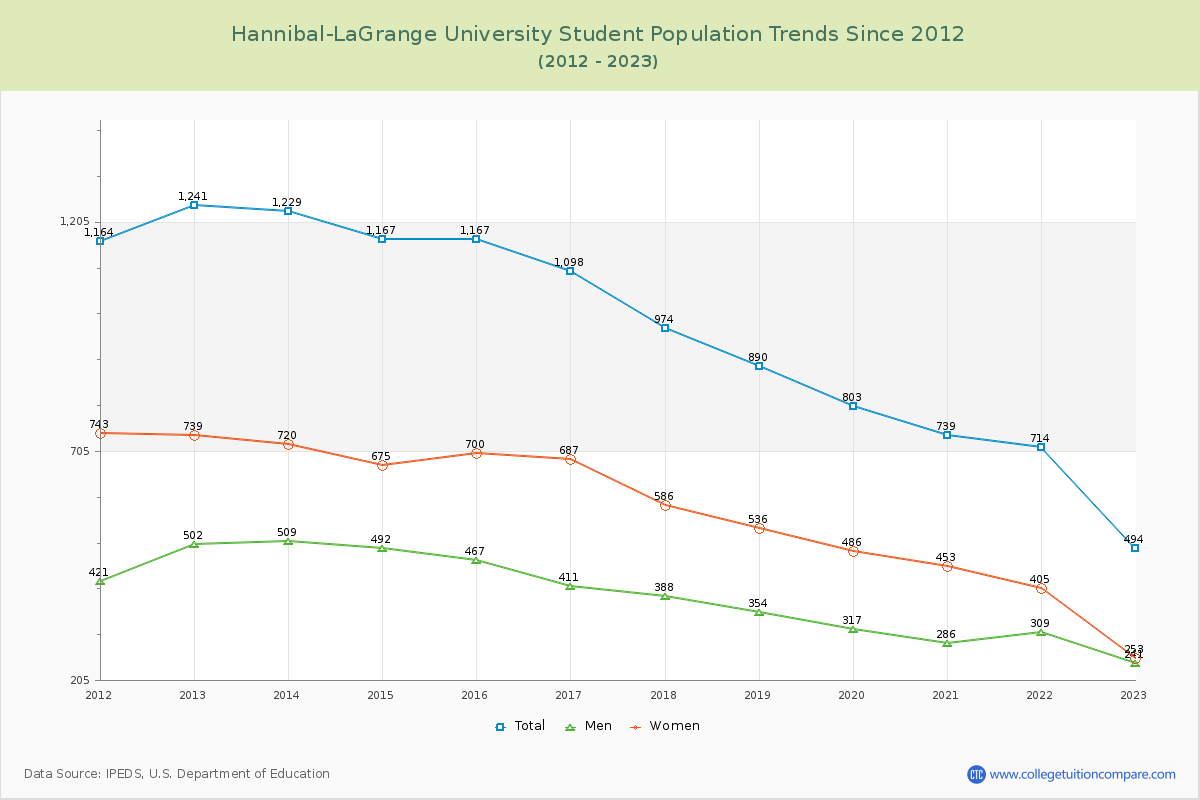
Student Population Changes
The average student population over the last 12 years is 956 where 494 students are attending the school for the academic year 2022-2023.
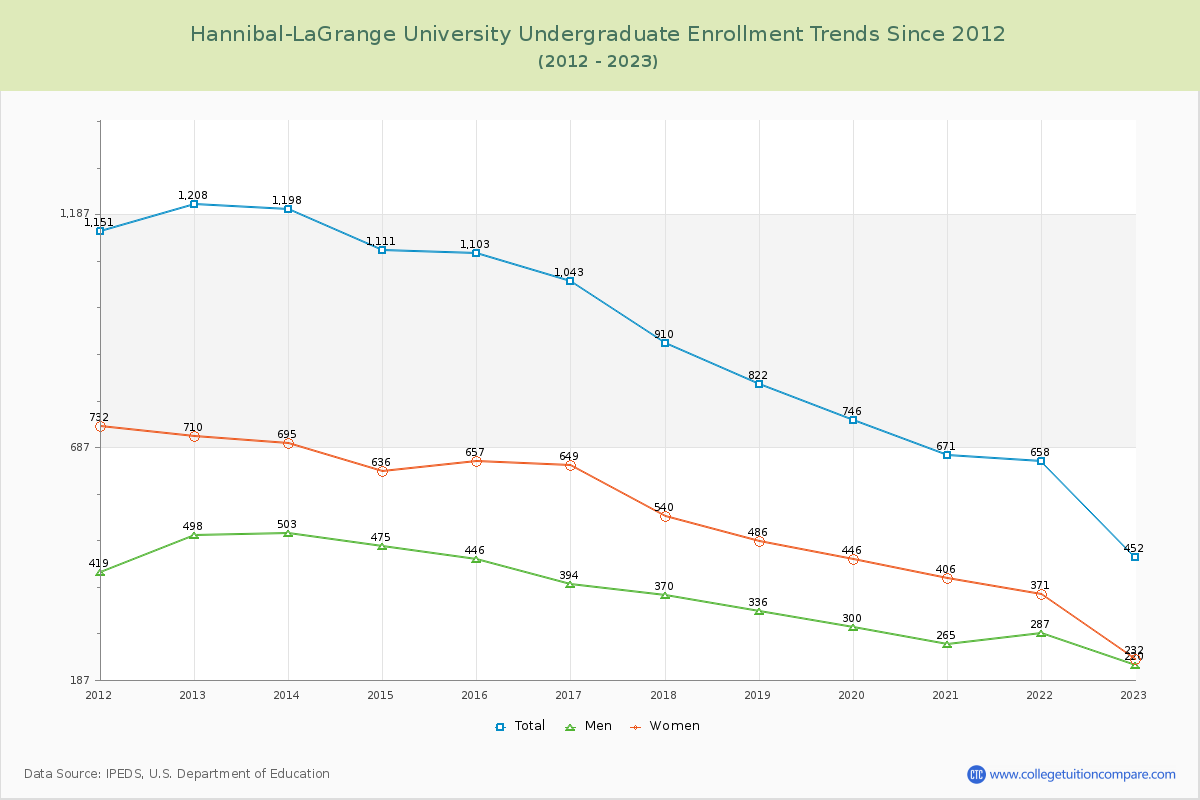
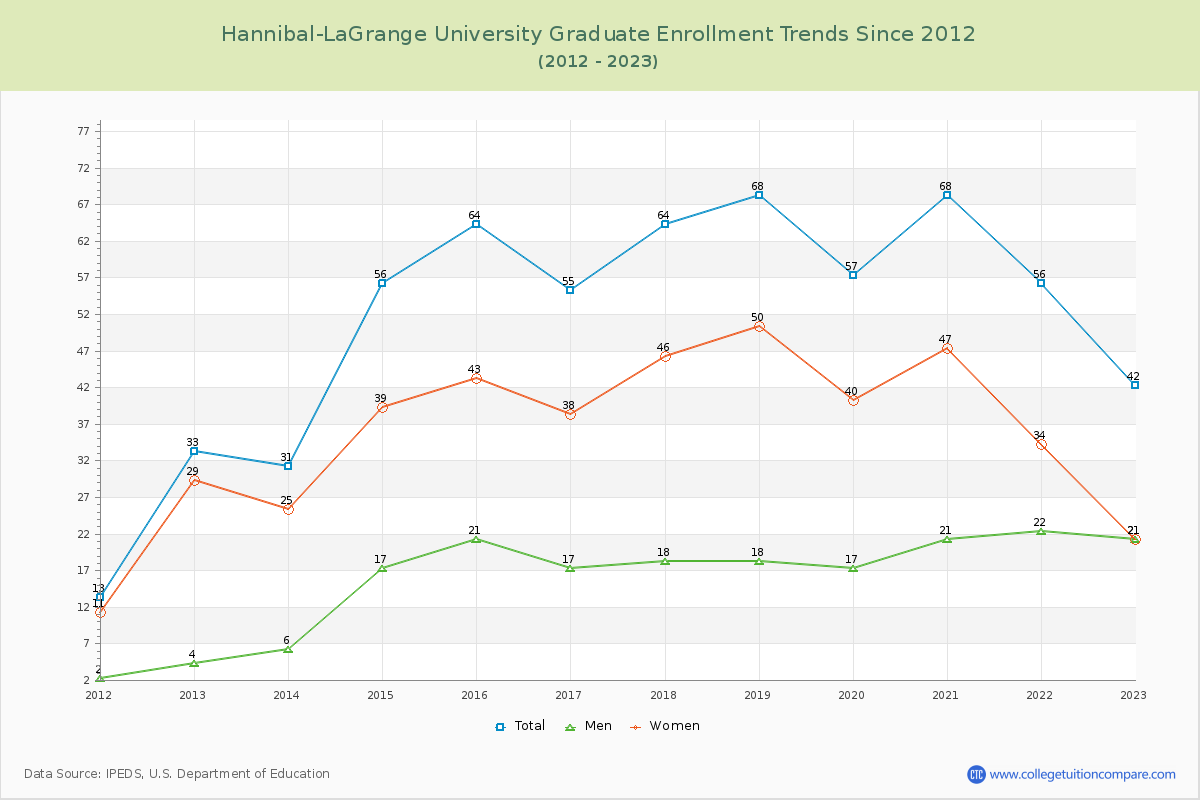
91.50% of total students is undergraduate students and 8.50% students is graduate students. The number of undergraduate students has decreased by 756 and the graduate enrollment has increased by 9 over past 10 years.
The female to male ratio is 1.05 to 1 and it means that there are similar numbers of female and male students enrolled in Hannibal-LaGrange.
The following table and chart illustrate the changes in student population by gender at Hannibal-LaGrange University since 2012.
| Year | Total | Undergraduate | Graduate | ||||
|---|---|---|---|---|---|---|---|
| Total | Men | Women | Total | Men | Women | ||
| 2012-13 | 1,241 | 1,208 | 498 | 710 | 33 | 4 | 29 |
| 2013-14 | 1,229 -12 | 1,198 -10 | 503 5 | 695 -15 | 31 -2 | 6 2 | 25 -4 |
| 2014-15 | 1,167 -62 | 1,111 -87 | 475 -28 | 636 -59 | 56 25 | 17 11 | 39 14 |
| 2015-16 | 1,167 0 | 1,103 -8 | 446 -29 | 657 21 | 64 8 | 21 4 | 43 4 |
| 2016-17 | 1,098 -69 | 1,043 -60 | 394 -52 | 649 -8 | 55 -9 | 17 -4 | 38 -5 |
| 2017-18 | 974 -124 | 910 -133 | 370 -24 | 540 -109 | 64 9 | 18 1 | 46 8 |
| 2018-19 | 890 -84 | 822 -88 | 336 -34 | 486 -54 | 68 4 | 18 0 | 50 4 |
| 2019-20 | 803 -87 | 746 -76 | 300 -36 | 446 -40 | 57 -11 | 17 -1 | 40 -10 |
| 2020-21 | 739 -64 | 671 -75 | 265 -35 | 406 -40 | 68 11 | 21 4 | 47 7 |
| 2021-22 | 714 -25 | 658 -13 | 287 22 | 371 -35 | 56 -12 | 22 1 | 34 -13 |
| 2022-23 | 494 -220 | 452 -206 | 220 -67 | 232 -139 | 42 -14 | 21 -1 | 21 -13 |
| Average | 956 | 902 | 372 | 530 | 54 | 17 | 37 |