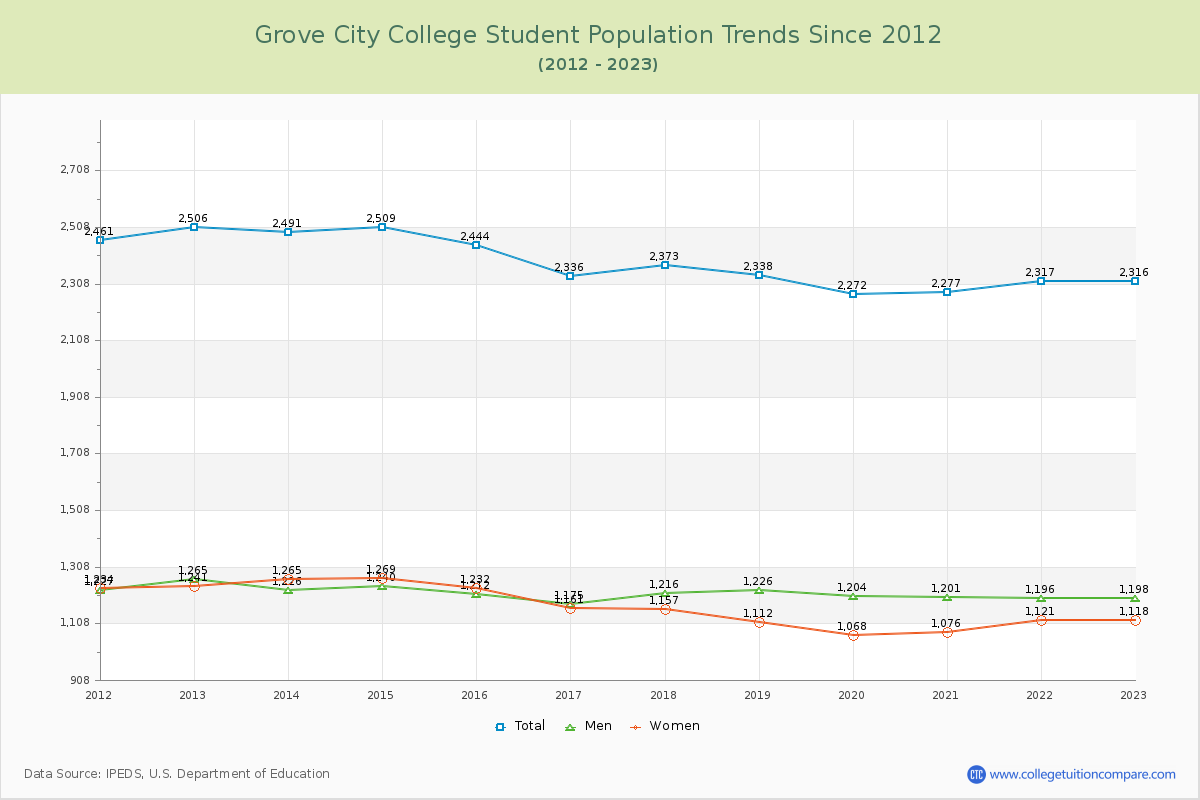
Student Population Changes
The average student population over the last 12 years is 2,380 where 2,316 students are attending the school for the academic year 2022-2023.
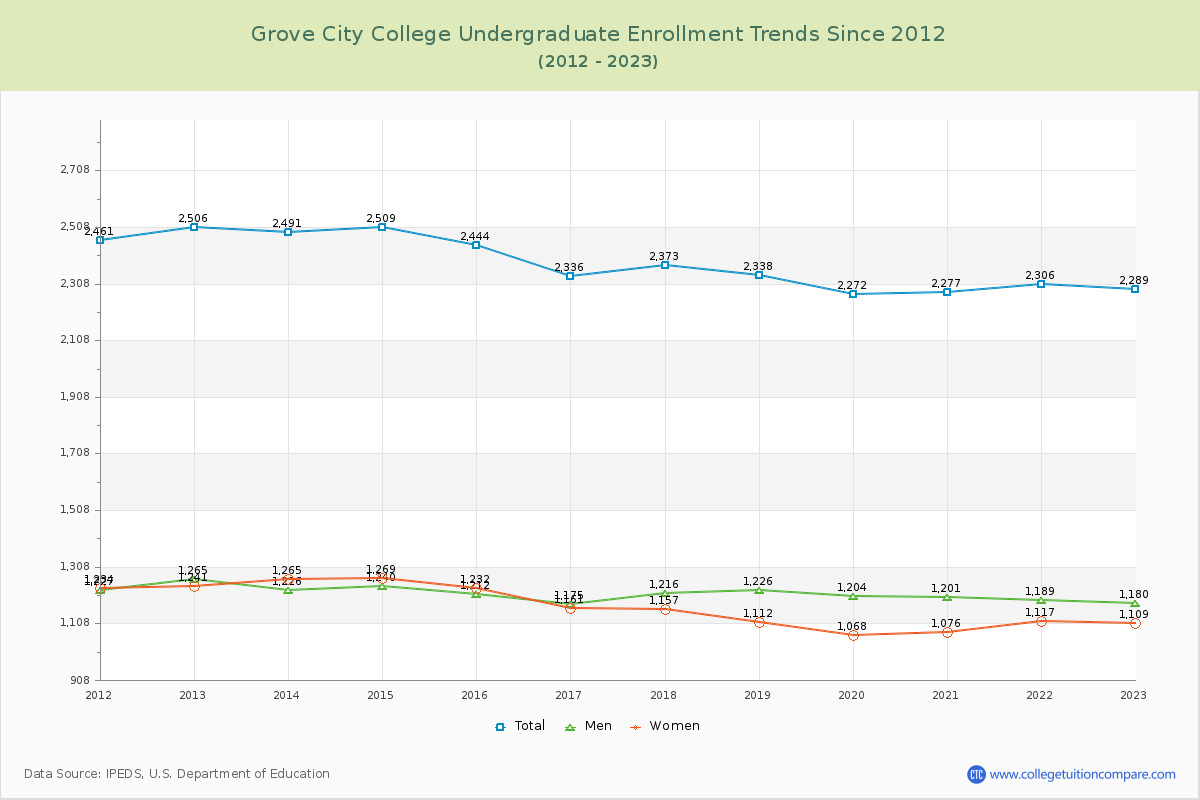
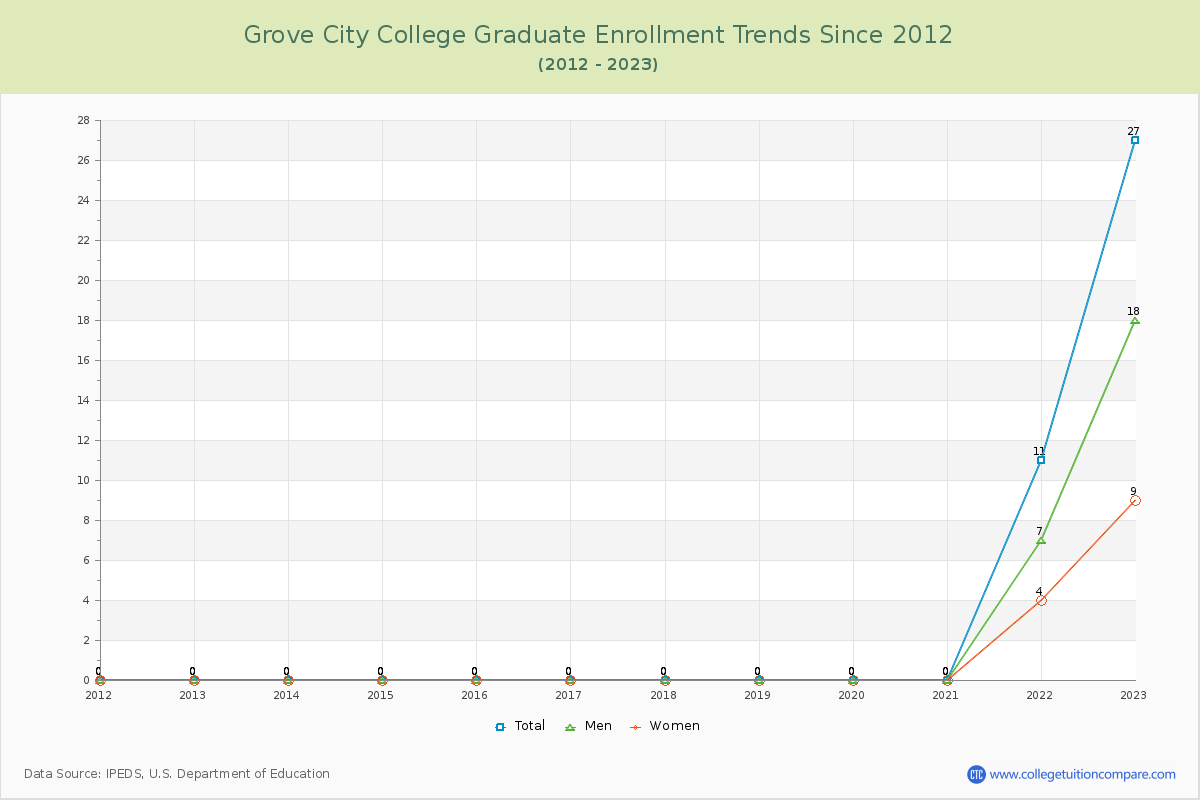
98.83% of total students is undergraduate students and 1.17% students is graduate students. The number of undergraduate students has decreased by 217 and the graduate enrollment has increased by 27 over past 10 years.
The female to male ratio is 0.93 to 1 and it means that there are similar numbers of female and male students enrolled in Grove City.
The following table and chart illustrate the changes in student population by gender at Grove City College since 2012.
| Year | Total | Undergraduate | Graduate | ||||
|---|---|---|---|---|---|---|---|
| Total | Men | Women | Total | Men | Women | ||
| 2012-13 | 2,506 | 2,506 | 1,265 | 1,241 | 0 | 0 | 0 |
| 2013-14 | 2,491 -15 | 2,491 -15 | 1,226 -39 | 1,265 24 | 0 0 | 0 0 | 0 0 |
| 2014-15 | 2,509 18 | 2,509 18 | 1,240 14 | 1,269 4 | 0 0 | 0 0 | 0 0 |
| 2015-16 | 2,444 -65 | 2,444 -65 | 1,212 -28 | 1,232 -37 | 0 0 | 0 0 | 0 0 |
| 2016-17 | 2,336 -108 | 2,336 -108 | 1,175 -37 | 1,161 -71 | 0 0 | 0 0 | 0 0 |
| 2017-18 | 2,373 37 | 2,373 37 | 1,216 41 | 1,157 -4 | 0 0 | 0 0 | 0 0 |
| 2018-19 | 2,338 -35 | 2,338 -35 | 1,226 10 | 1,112 -45 | 0 0 | 0 0 | 0 0 |
| 2019-20 | 2,272 -66 | 2,272 -66 | 1,204 -22 | 1,068 -44 | 0 0 | 0 0 | 0 0 |
| 2020-21 | 2,277 5 | 2,277 5 | 1,201 -3 | 1,076 8 | 0 0 | 0 0 | 0 0 |
| 2021-22 | 2,317 40 | 2,306 29 | 1,189 -12 | 1,117 41 | 11 11 | 7 7 | 4 4 |
| 2022-23 | 2,316 -1 | 2,289 -17 | 1,180 -9 | 1,109 -8 | 27 16 | 18 11 | 9 5 |
| Average | 2,380 | 2,376 | 1,212 | 1,164 | 3 | 2 | 1 |