Enrollment Trends at Great Lakes Institute of Technology

-46

Total Enrollment

2

Men

-48

Women

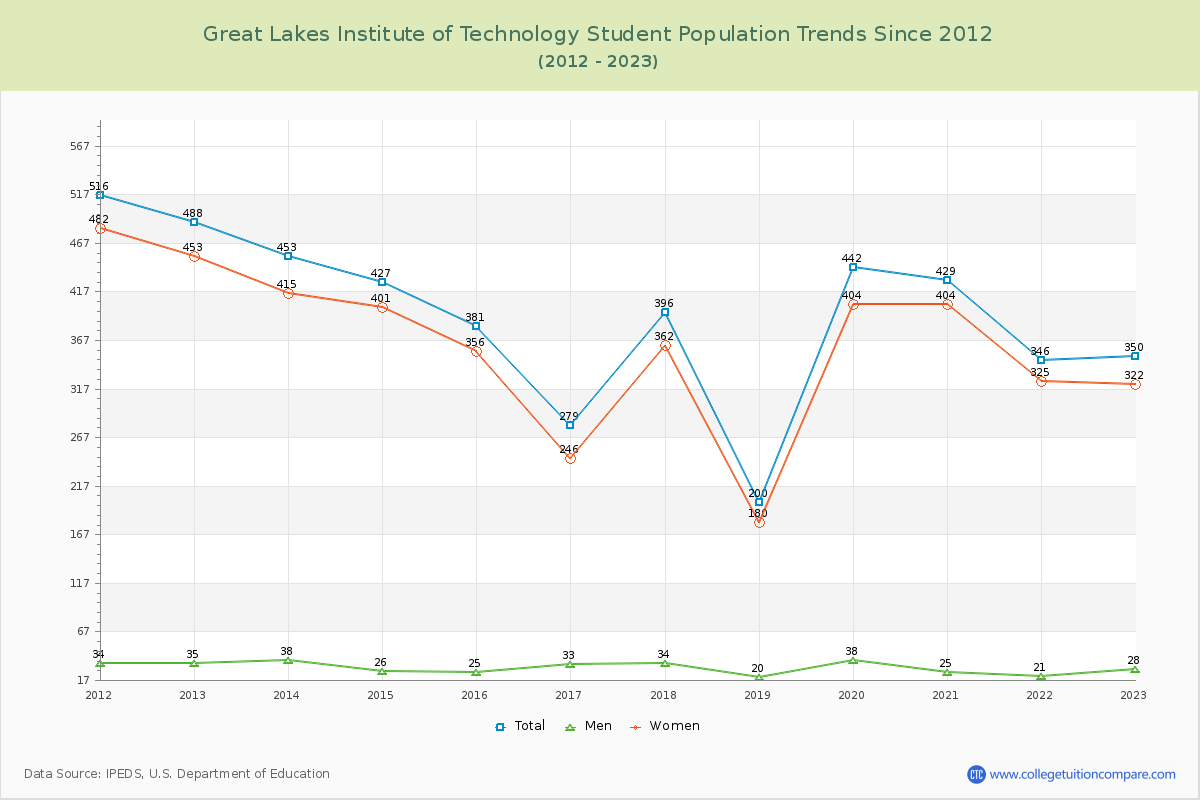
The student population at Great Lakes Institute of Technology is 335 (all undergraduate). The number of students has decreased by 46 over the past decade.

The female to male ratio is 11.41 to 1 which means that majority of population is on female students.

2 students enrolled in online degree program exclusively and the number of online students has decreased by % since 2015.

Student Population Changes

The average student population over the last 11 years is 346 where 335 students are attending the school for the academic year 2024-2025.

The female to male ratio is 11.41 to 1 and it means that there are far more female students enrolled in Great Lakes Institute of Technology than male students.

The following table and chart illustrate the changes in student population by gender at Great Lakes Institute of Technology since 2015.

YearTotalMenWomen
2015-1638125356
2016-17279
-102
33
8
246
-110
2017-18396
117
34
1
362
116
2018-19200
-196
20
-14
180
-182
2019-20442
242
38
18
404
224
2020-21429
-13
25
-13
404
2021-22346
-83
21
-4
325
-79
2022-23350
4
28
7
322
-3
2023-24303
-47
28275
-47
2024-25335
32
27
-1
308
33
Average34628318
Great Lakes Institute of Technology Enrollment Trends Chart

Enrollment by Race/Ethnicity Changes

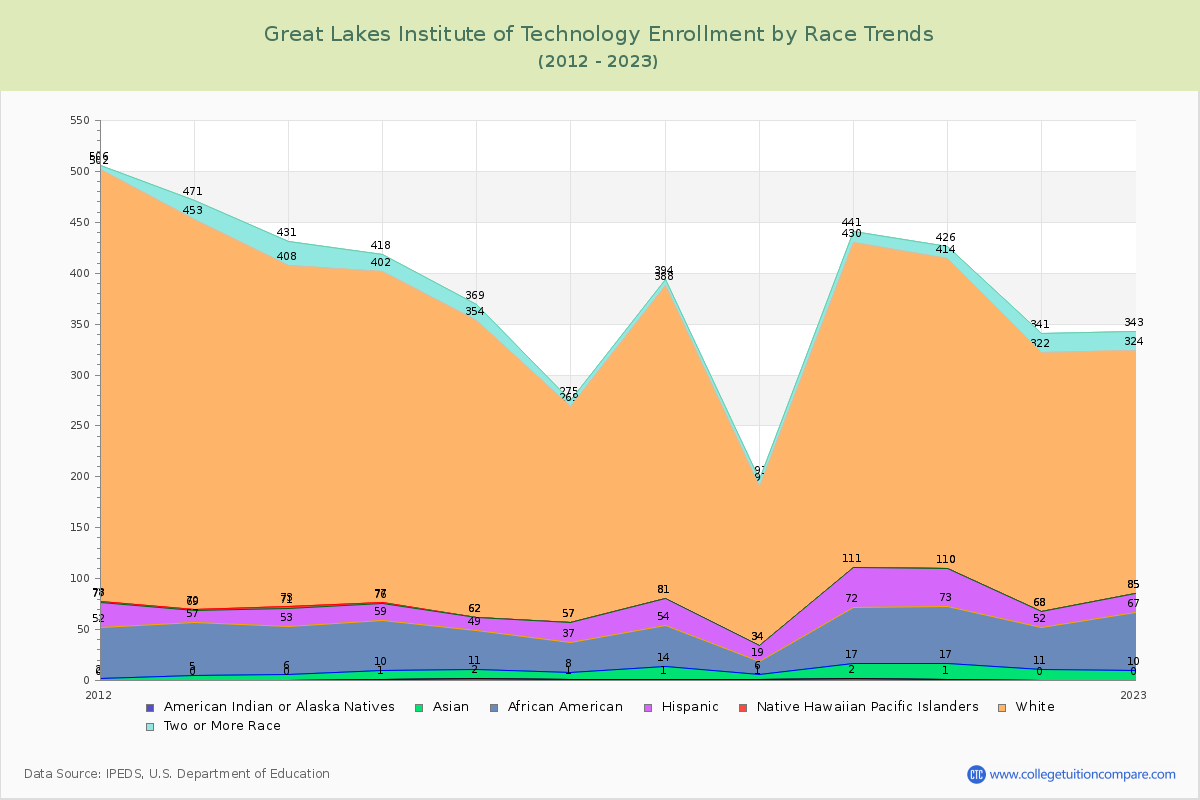
The percentage of white students is 72.54%. The percentage was 76.64% 10 years ago and Great Lakes Institute of Technology still has a high percentage of white students. 2.09% of enrolled students is Asian and 11.04% is black students. Hispanic students comprise 8.06% of the student body.

Over the past 10 years, the racial composition has shifted. The percentage of white students decreased from 76.64% to 72.54%. Asian enrollment declined from 2.36% to 2.09%. Black student enrollment increased from 9.97% to 11.04%. Hispanic student representation expanded from 3.41% to 8.06%.

The overall racial diversity, measured by the Census Bureau Diversity Index, is 0.4527 which indicates that somewhat diverse. This increased from 0.3994 a decade ago, suggesting that racial diversity has improved.

The following table and chart illustrate the student population trends by race/ethnicity at Great Lakes Institute of Technology over the past 11 years (2015-2025).

YearAmerican Indian or Native AmericanAsianBlackHispanicNative Hawaiian or Other Pacific IslanderWhiteTwo or More Races
2015-16293813029215
2016-1717292002126
2017-18113402703076
2018-1915131501576
2019-202155539031911
2020-211165637030412
2021-220114116025419
2022-230105718023919
2023-2403352212315
2024-25073727124315
Average1104023025611
Great Lakes Institute of Technology Enrollment by Race Trends Chart

Distance Learning (Online Courses) Enrollment Changes

2 students are enrolled in online degree programs exclusively for the academic year 2024-2025, which is 1% of total students. The number of online students has decreased % since 2015. The following table and chart illustrate the changes in the online student population by enrolled type at Great Lakes Institute of Technology from 2015 to 2025.

YearTotal EnrollmentOnline CompletelyEnrolled in Some Online CoursesNot Enrolled in Online Courses
2015-1638100381
2016-1727900279
2017-1839600396
2018-1920000200
2019-2044200442
2020-2142900429
2021-2234600346
2022-23350025793
2023-24303221685
2024-25335226172
Average346073272

Ratings & Review

Share your experiences and thoughts about Great Lakes Institute of Technology. It will be a great help to applicants and prospective students!