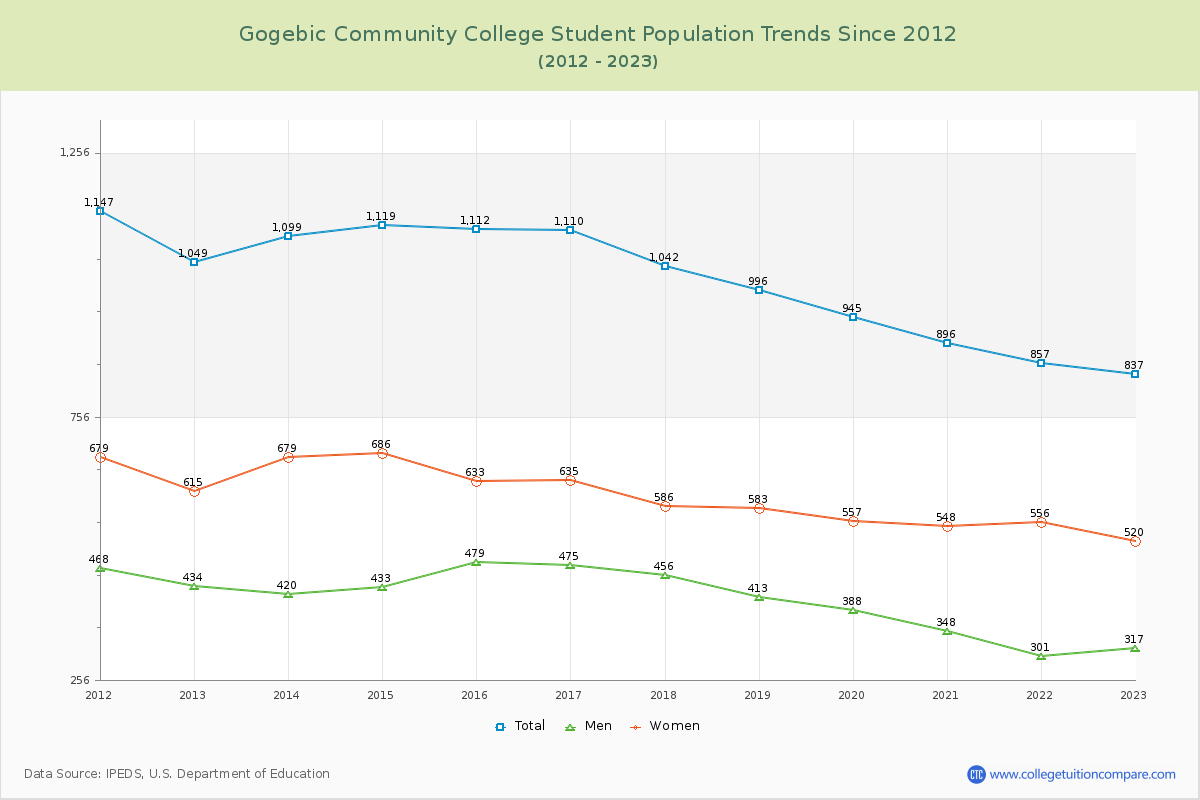
Student Population Changes
The average student population over the last 12 years is 1,006 where 837 students are attending the school for the academic year 2022-2023.
The female to male ratio is 1.64 to 1 and it means that there are more female students enrolled in Gogebic CC than male students.
The following table and chart illustrate the changes in student population by gender at Gogebic Community College since 2012.
| Year | Total | Men | Women |
|---|---|---|---|
| 2012-13 | 1,049 | 434 | 615 |
| 2013-14 | 1,099 50 | 420 -14 | 679 64 |
| 2014-15 | 1,119 20 | 433 13 | 686 7 |
| 2015-16 | 1,112 -7 | 479 46 | 633 -53 |
| 2016-17 | 1,110 -2 | 475 -4 | 635 2 |
| 2017-18 | 1,042 -68 | 456 -19 | 586 -49 |
| 2018-19 | 996 -46 | 413 -43 | 583 -3 |
| 2019-20 | 945 -51 | 388 -25 | 557 -26 |
| 2020-21 | 896 -49 | 348 -40 | 548 -9 |
| 2021-22 | 857 -39 | 301 -47 | 556 8 |
| 2022-23 | 837 -20 | 317 16 | 520 -36 |
| Average | 1,006 | 406 | 600 |