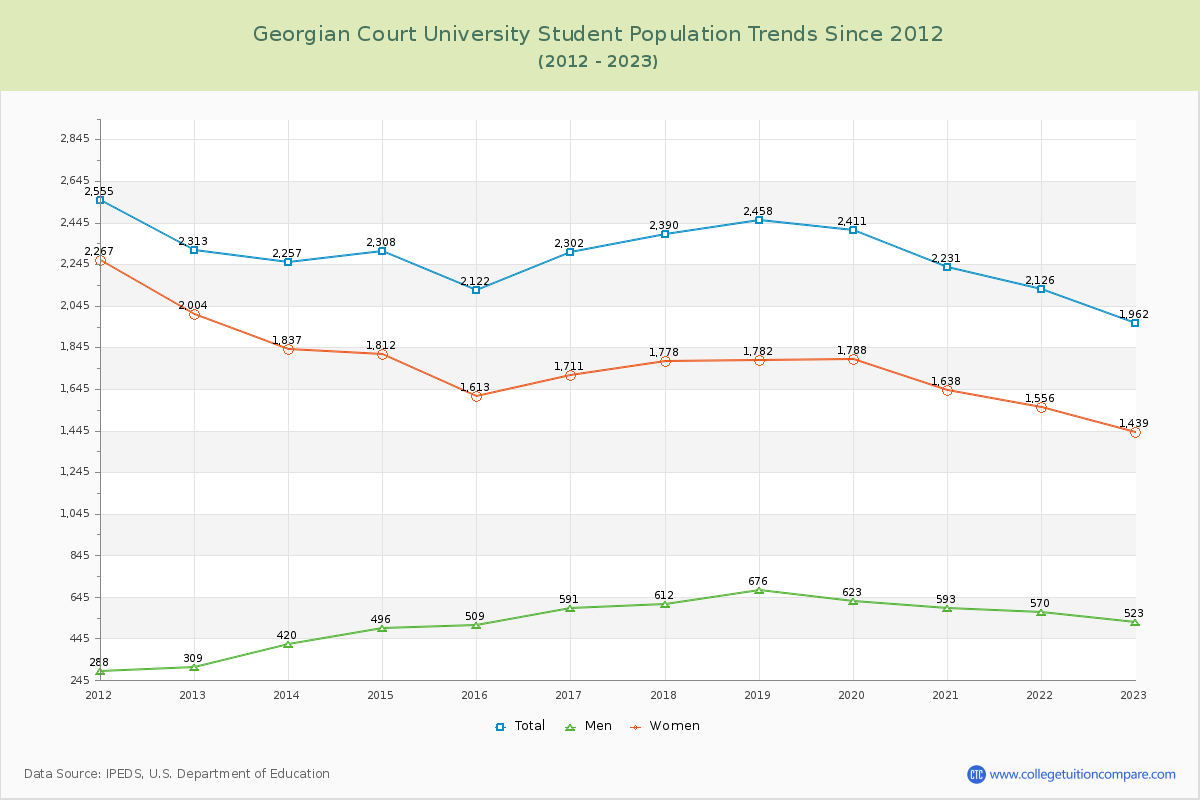
Student Population Changes
The average student population over the last 12 years is 2,262 where 1,962 students are attending the school for the academic year 2022-2023.
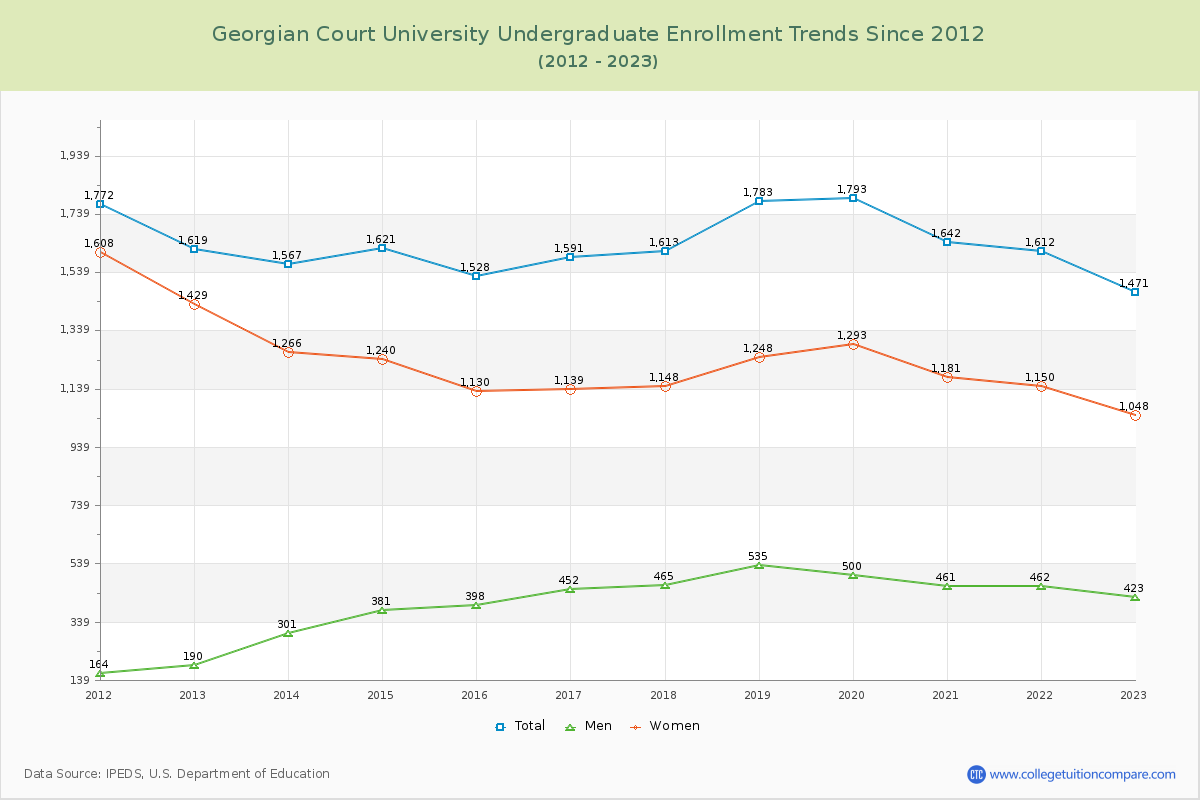
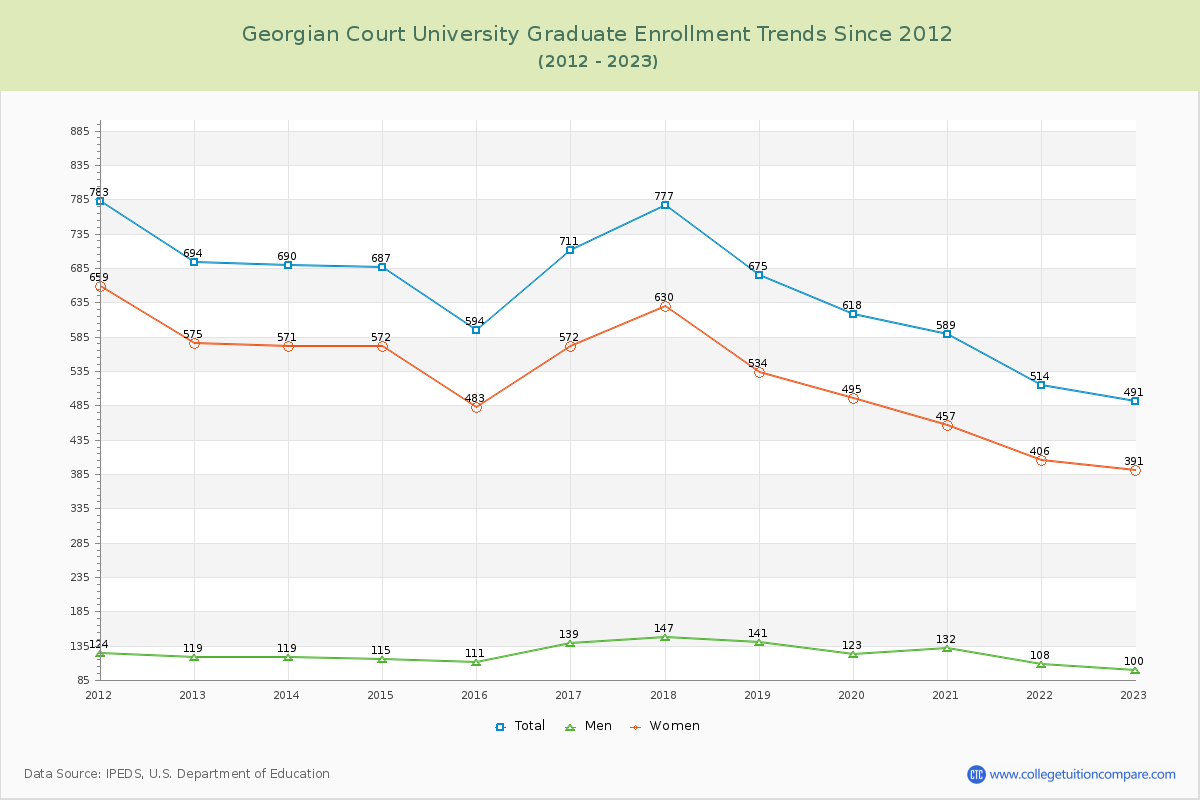
74.97% of total students is undergraduate students and 25.03% students is graduate students. The number of undergraduate students has decreased by 148 and the graduate enrollment has decreased by 203 over past 10 years.
The female to male ratio is 2.75 to 1 and it means that there are far more female students enrolled in Georgian Court than male students.
The following table and chart illustrate the changes in student population by gender at Georgian Court University since 2012.
| Year | Total | Undergraduate | Graduate | ||||
|---|---|---|---|---|---|---|---|
| Total | Men | Women | Total | Men | Women | ||
| 2012-13 | 2,313 | 1,619 | 190 | 1,429 | 694 | 119 | 575 |
| 2013-14 | 2,257 -56 | 1,567 -52 | 301 111 | 1,266 -163 | 690 -4 | 119 0 | 571 -4 |
| 2014-15 | 2,308 51 | 1,621 54 | 381 80 | 1,240 -26 | 687 -3 | 115 -4 | 572 1 |
| 2015-16 | 2,122 -186 | 1,528 -93 | 398 17 | 1,130 -110 | 594 -93 | 111 -4 | 483 -89 |
| 2016-17 | 2,302 180 | 1,591 63 | 452 54 | 1,139 9 | 711 117 | 139 28 | 572 89 |
| 2017-18 | 2,390 88 | 1,613 22 | 465 13 | 1,148 9 | 777 66 | 147 8 | 630 58 |
| 2018-19 | 2,458 68 | 1,783 170 | 535 70 | 1,248 100 | 675 -102 | 141 -6 | 534 -96 |
| 2019-20 | 2,411 -47 | 1,793 10 | 500 -35 | 1,293 45 | 618 -57 | 123 -18 | 495 -39 |
| 2020-21 | 2,231 -180 | 1,642 -151 | 461 -39 | 1,181 -112 | 589 -29 | 132 9 | 457 -38 |
| 2021-22 | 2,126 -105 | 1,612 -30 | 462 1 | 1,150 -31 | 514 -75 | 108 -24 | 406 -51 |
| 2022-23 | 1,962 -164 | 1,471 -141 | 423 -39 | 1,048 -102 | 491 -23 | 100 -8 | 391 -15 |
| Average | 2,262 | 1,622 | 415 | 1,207 | 640 | 123 | 517 |