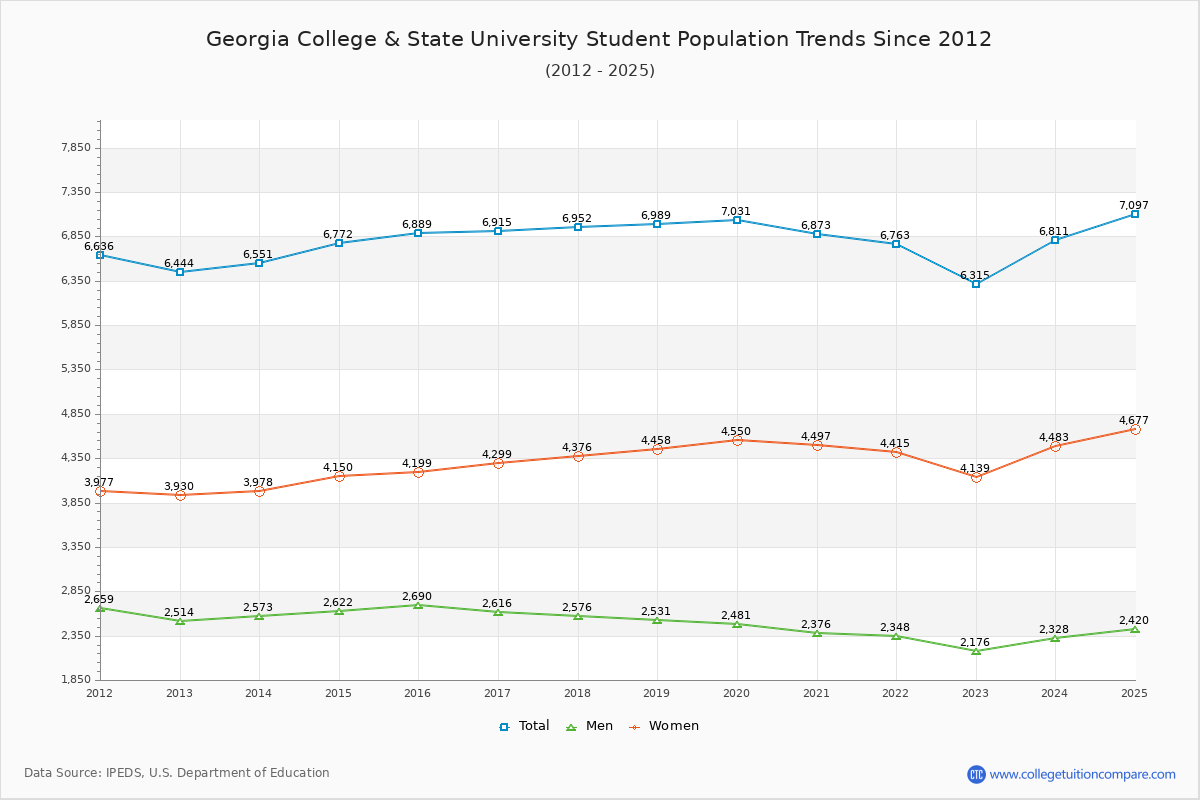
Student Population Changes
The average student population over the last 12 years is 6,772 where 6,315 students are attending the school for the academic year 2022-2023.
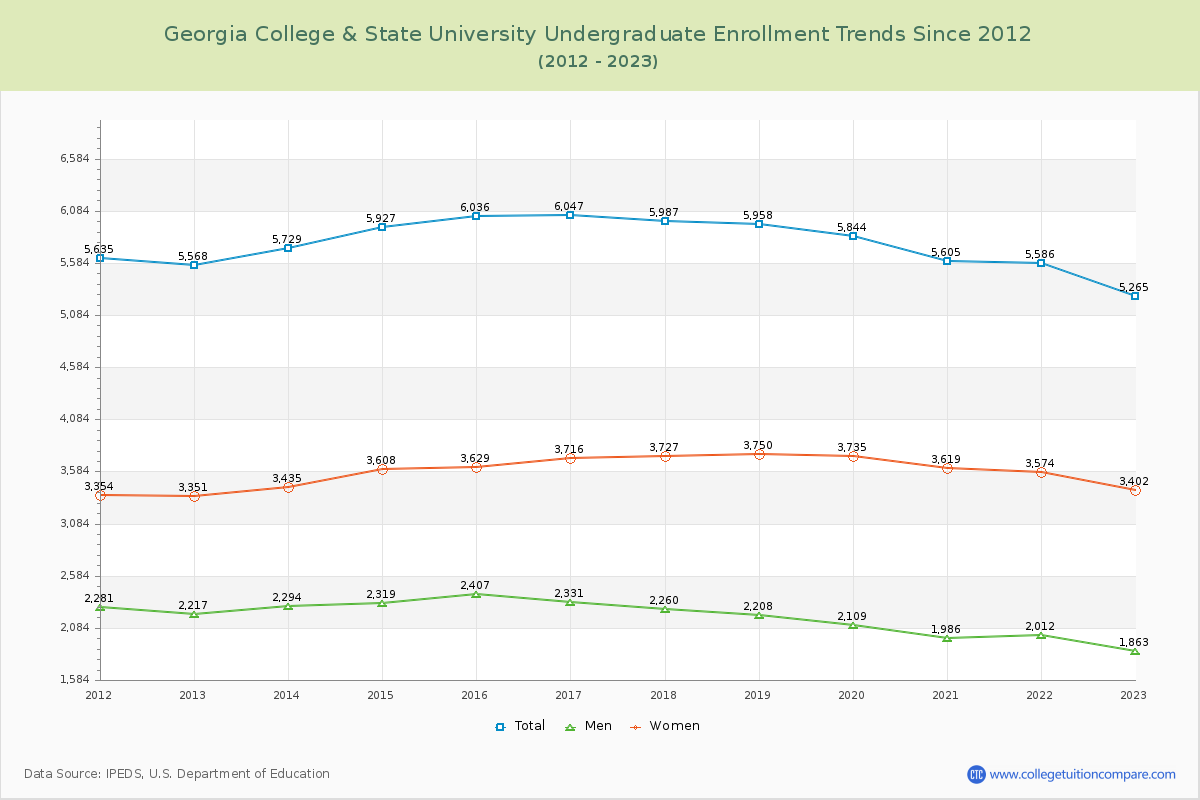
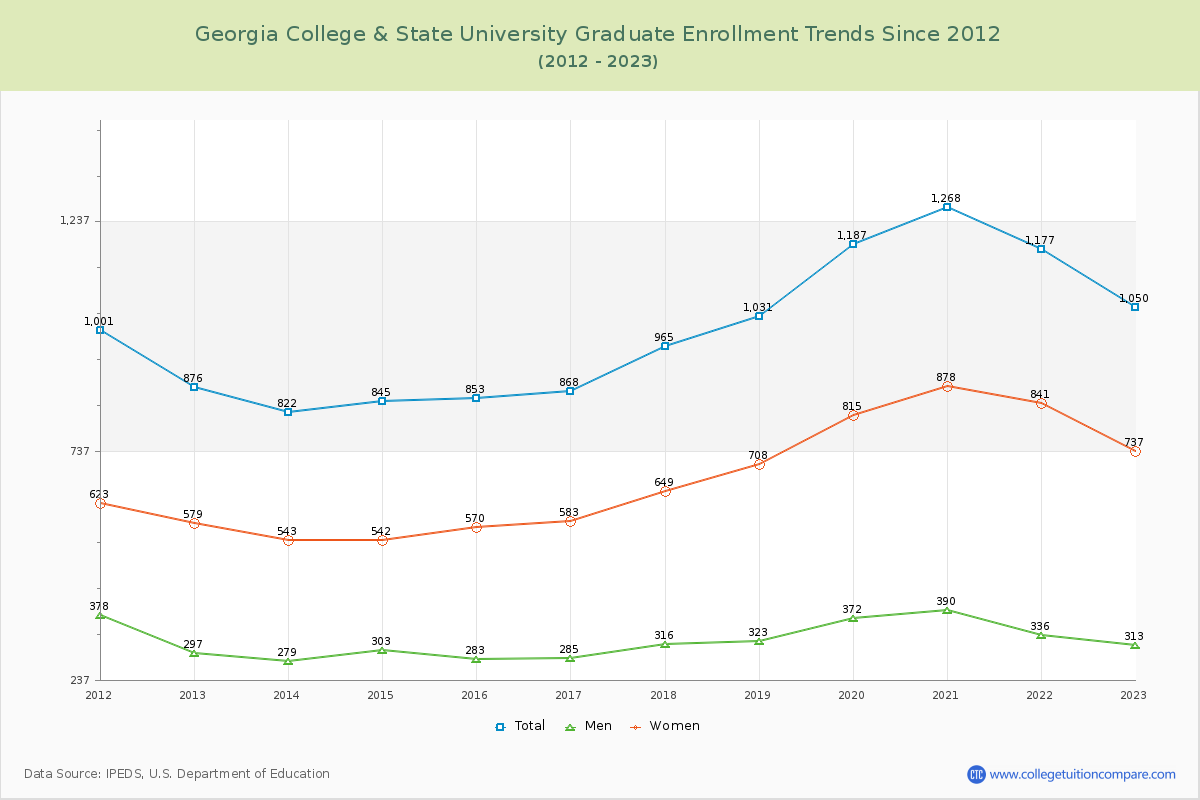
83.37% of total students is undergraduate students and 16.63% students is graduate students. The number of undergraduate students has decreased by 303 and the graduate enrollment has increased by 174 over past 10 years.
The female to male ratio is 1.90 to 1 and it means that there are more female students enrolled in Georgia College than male students.
The following table and chart illustrate the changes in student population by gender at Georgia College & State University since 2012.
| Year | Total | Undergraduate | Graduate | ||||
|---|---|---|---|---|---|---|---|
| Total | Men | Women | Total | Men | Women | ||
| 2012-13 | 6,444 | 5,568 | 2,217 | 3,351 | 876 | 297 | 579 |
| 2013-14 | 6,551 107 | 5,729 161 | 2,294 77 | 3,435 84 | 822 -54 | 279 -18 | 543 -36 |
| 2014-15 | 6,772 221 | 5,927 198 | 2,319 25 | 3,608 173 | 845 23 | 303 24 | 542 -1 |
| 2015-16 | 6,889 117 | 6,036 109 | 2,407 88 | 3,629 21 | 853 8 | 283 -20 | 570 28 |
| 2016-17 | 6,915 26 | 6,047 11 | 2,331 -76 | 3,716 87 | 868 15 | 285 2 | 583 13 |
| 2017-18 | 6,952 37 | 5,987 -60 | 2,260 -71 | 3,727 11 | 965 97 | 316 31 | 649 66 |
| 2018-19 | 6,989 37 | 5,958 -29 | 2,208 -52 | 3,750 23 | 1,031 66 | 323 7 | 708 59 |
| 2019-20 | 7,031 42 | 5,844 -114 | 2,109 -99 | 3,735 -15 | 1,187 156 | 372 49 | 815 107 |
| 2020-21 | 6,873 -158 | 5,605 -239 | 1,986 -123 | 3,619 -116 | 1,268 81 | 390 18 | 878 63 |
| 2021-22 | 6,763 -110 | 5,586 -19 | 2,012 26 | 3,574 -45 | 1,177 -91 | 336 -54 | 841 -37 |
| 2022-23 | 6,315 -448 | 5,265 -321 | 1,863 -149 | 3,402 -172 | 1,050 -127 | 313 -23 | 737 -104 |
| Average | 6,772 | 5,777 | 2,182 | 3,595 | 995 | 318 | 677 |