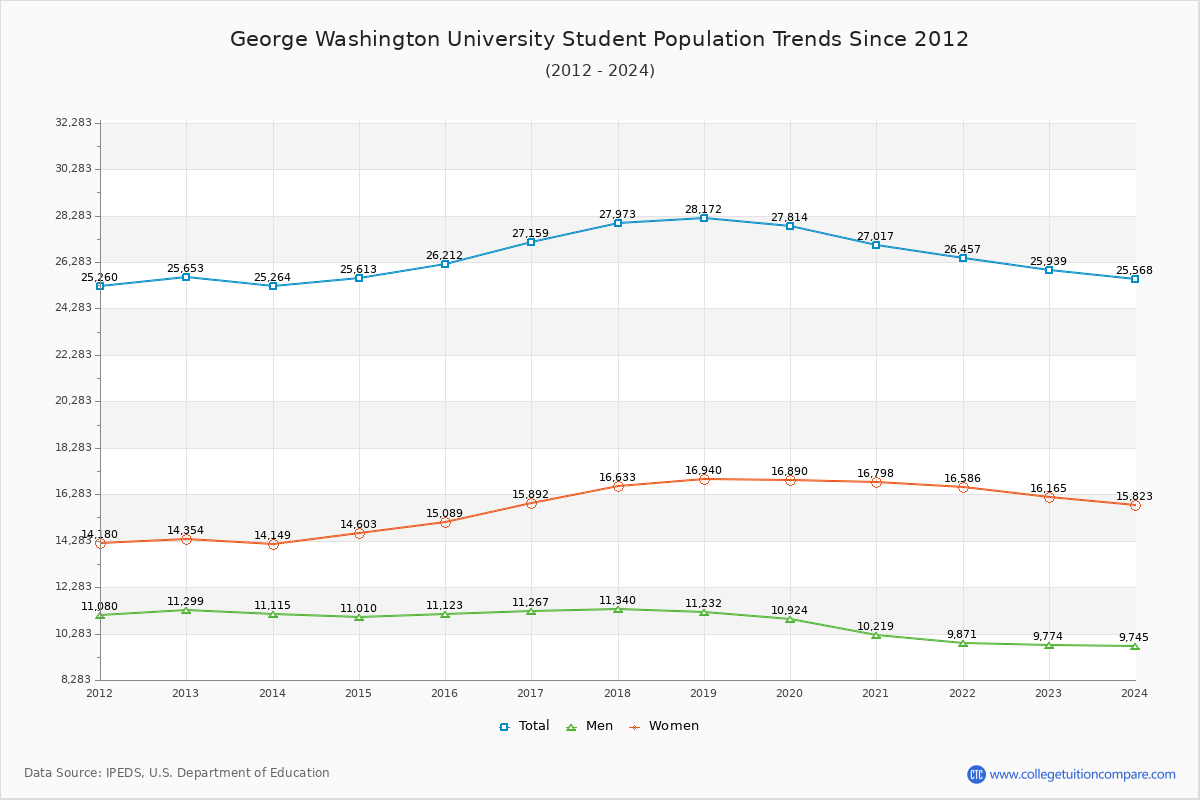
Student Population Changes
The average student population over the last 12 years is 26,661 where 25,939 students are attending the school for the academic year 2022-2023.
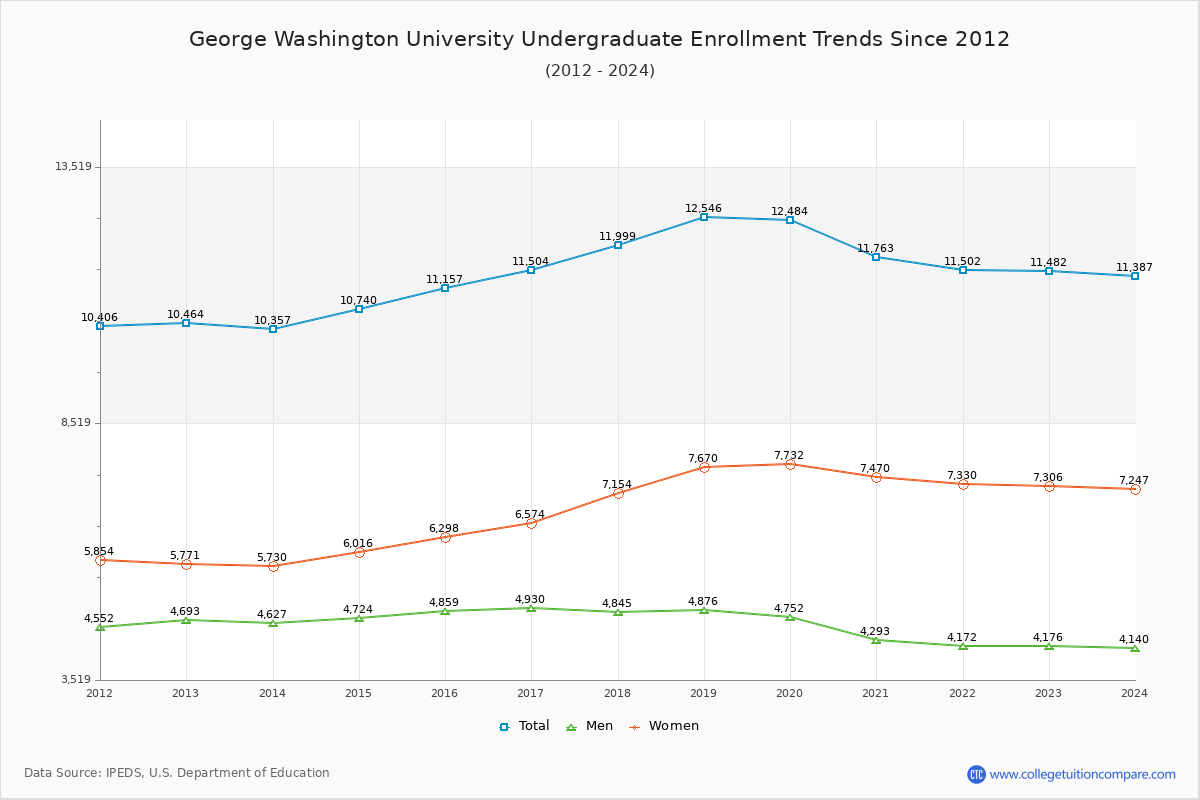
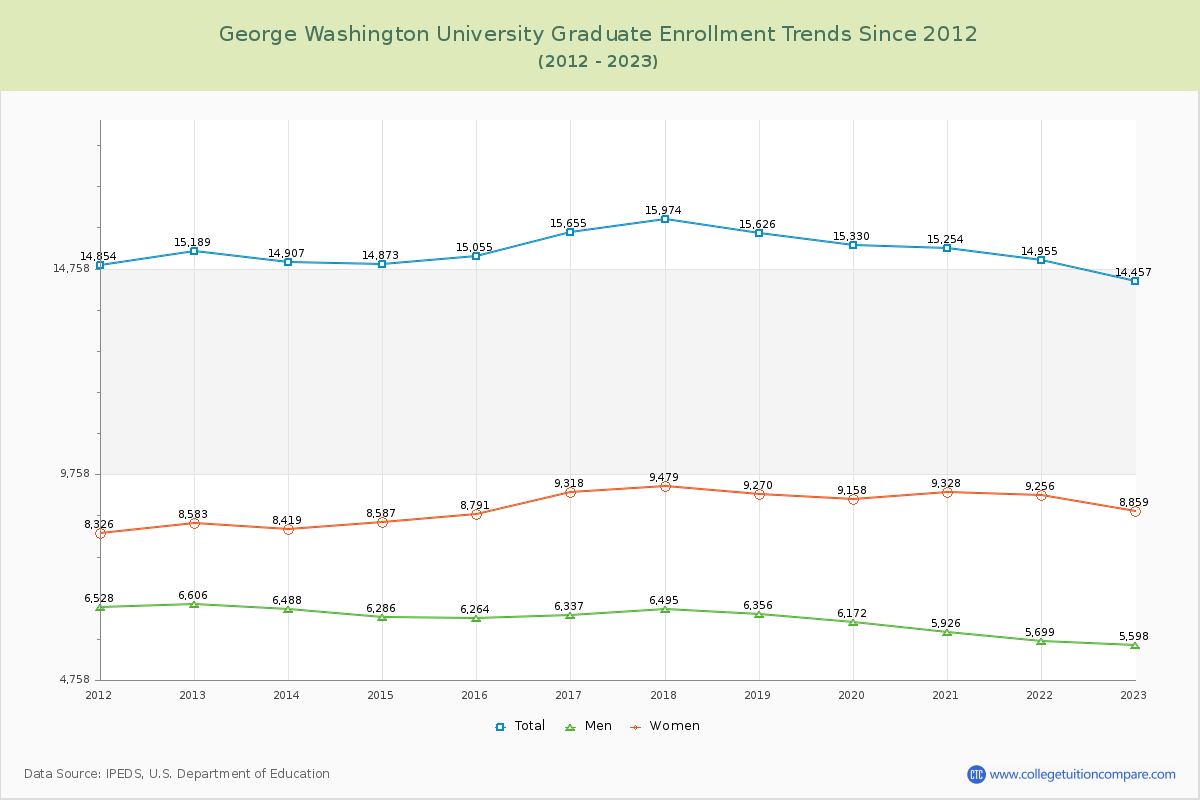
44.27% of total students is undergraduate students and 55.73% students is graduate students. The number of undergraduate students has increased by 1,018 and the graduate enrollment has decreased by 732 over past 10 years.
The female to male ratio is 1.65 to 1 and it means that there are more female students enrolled in GWU than male students.
The following table and chart illustrate the changes in student population by gender at George Washington University since 2012.
| Year | Total | Undergraduate | Graduate | ||||
|---|---|---|---|---|---|---|---|
| Total | Men | Women | Total | Men | Women | ||
| 2012-13 | 25,653 | 10,464 | 4,693 | 5,771 | 15,189 | 6,606 | 8,583 |
| 2013-14 | 25,264 -389 | 10,357 -107 | 4,627 -66 | 5,730 -41 | 14,907 -282 | 6,488 -118 | 8,419 -164 |
| 2014-15 | 25,613 349 | 10,740 383 | 4,724 97 | 6,016 286 | 14,873 -34 | 6,286 -202 | 8,587 168 |
| 2015-16 | 26,212 599 | 11,157 417 | 4,859 135 | 6,298 282 | 15,055 182 | 6,264 -22 | 8,791 204 |
| 2016-17 | 27,159 947 | 11,504 347 | 4,930 71 | 6,574 276 | 15,655 600 | 6,337 73 | 9,318 527 |
| 2017-18 | 27,973 814 | 11,999 495 | 4,845 -85 | 7,154 580 | 15,974 319 | 6,495 158 | 9,479 161 |
| 2018-19 | 28,172 199 | 12,546 547 | 4,876 31 | 7,670 516 | 15,626 -348 | 6,356 -139 | 9,270 -209 |
| 2019-20 | 27,814 -358 | 12,484 -62 | 4,752 -124 | 7,732 62 | 15,330 -296 | 6,172 -184 | 9,158 -112 |
| 2020-21 | 27,017 -797 | 11,763 -721 | 4,293 -459 | 7,470 -262 | 15,254 -76 | 5,926 -246 | 9,328 170 |
| 2021-22 | 26,457 -560 | 11,502 -261 | 4,172 -121 | 7,330 -140 | 14,955 -299 | 5,699 -227 | 9,256 -72 |
| 2022-23 | 25,939 -518 | 11,482 -20 | 4,176 4 | 7,306 -24 | 14,457 -498 | 5,598 -101 | 8,859 -397 |
| Average | 26,661 | 11,454 | 4,632 | 6,823 | 15,207 | 6,202 | 9,004 |