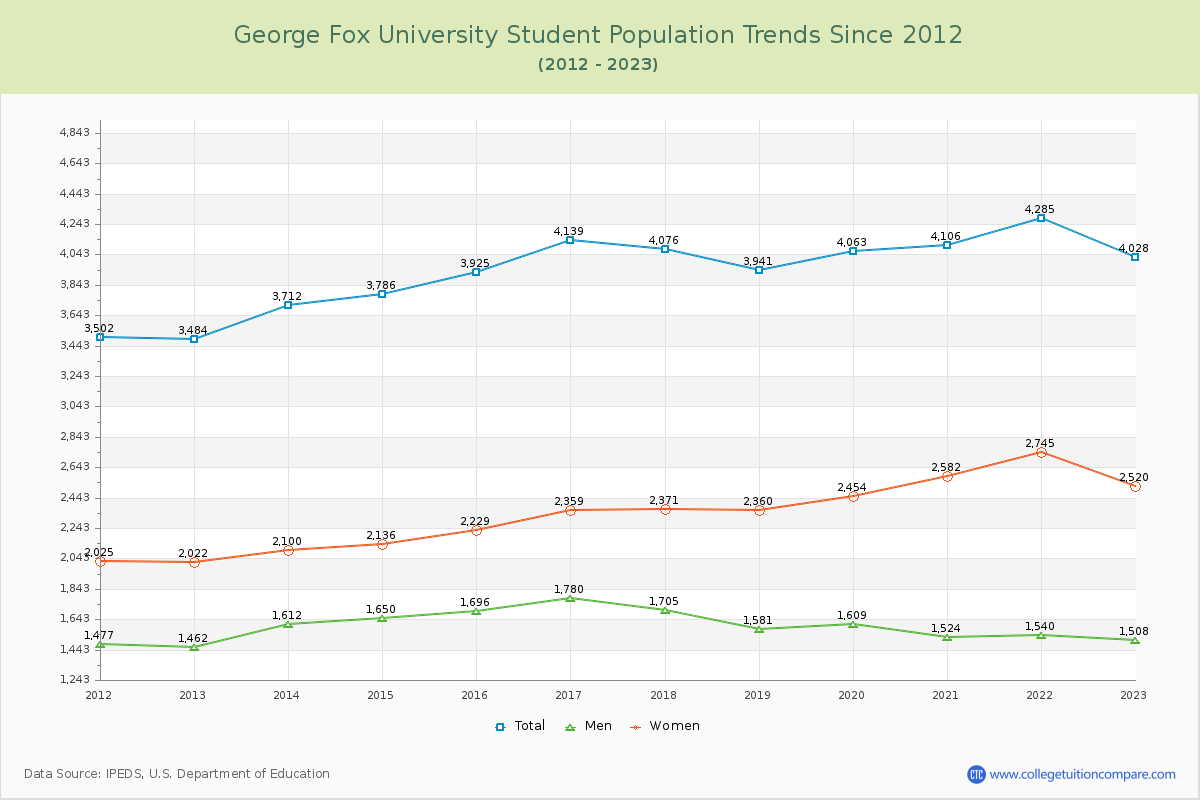
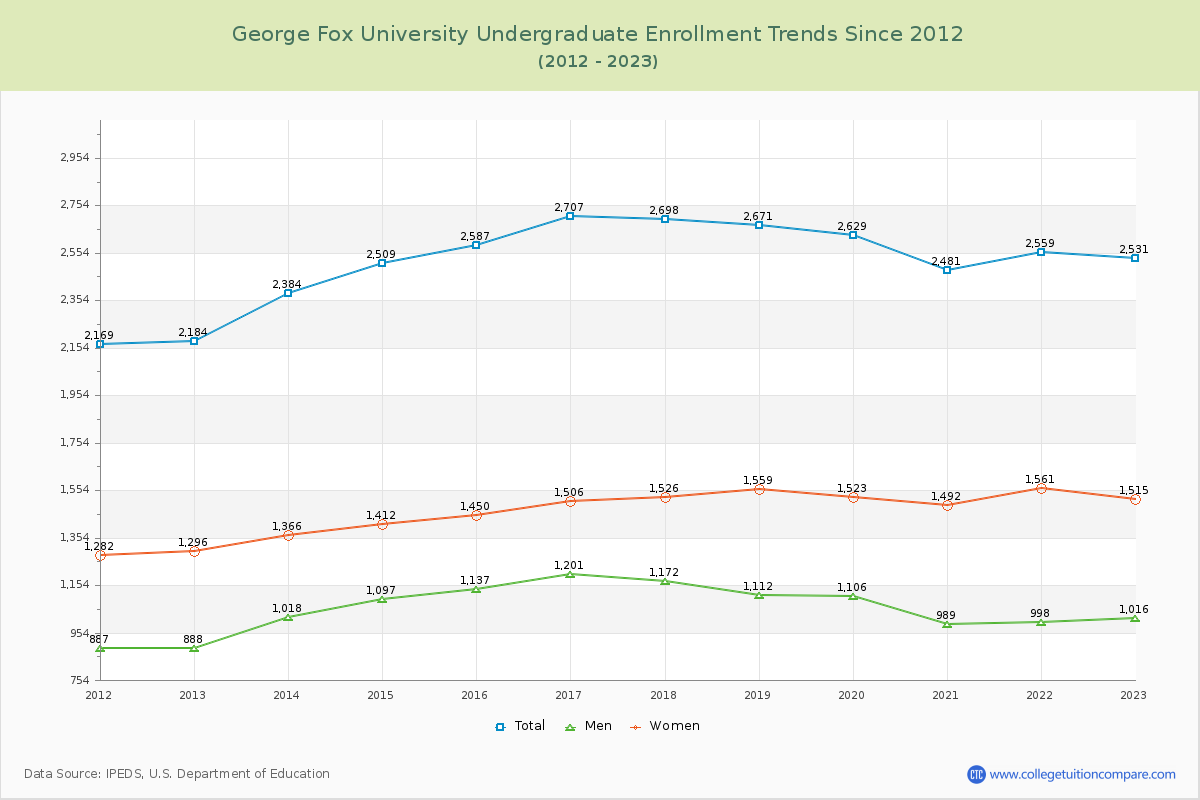
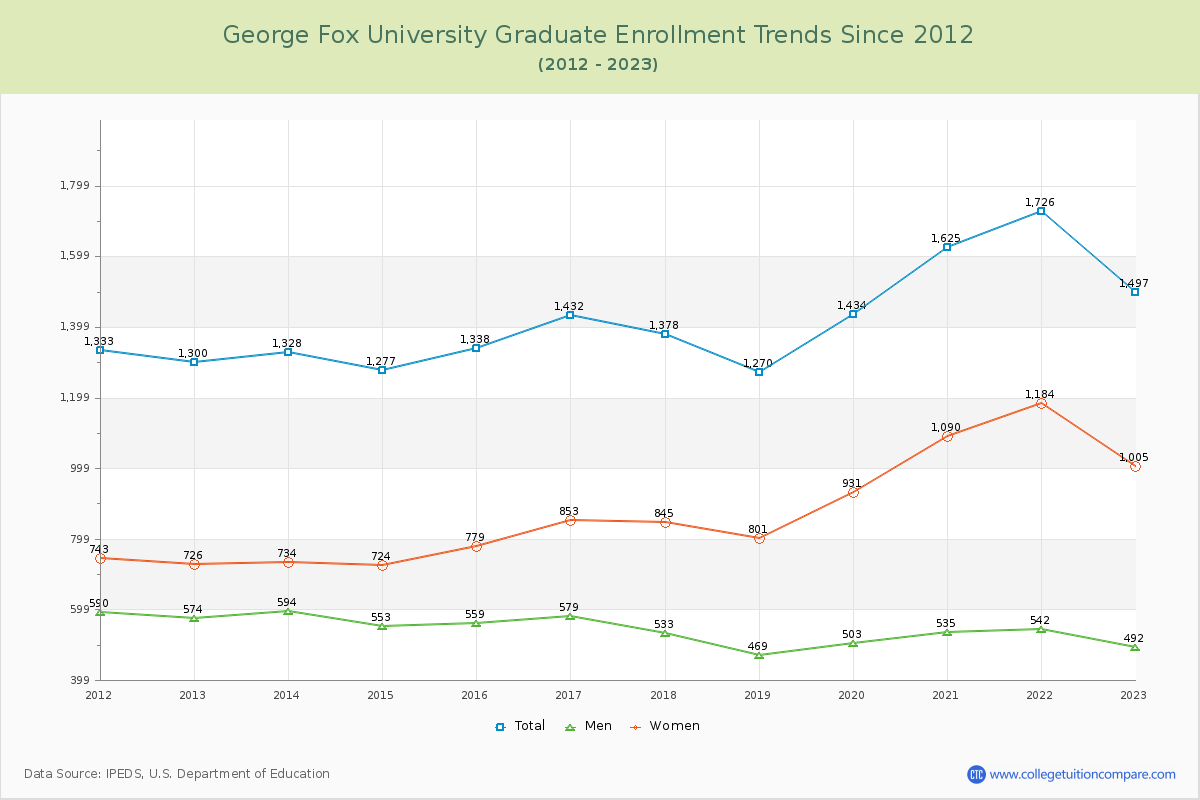
Student Population Changes
The average student population over the last 12 years is 3,959 where 4,028 students are attending the school for the academic year 2022-2023.
62.84% of total students is undergraduate students and 37.16% students is graduate students. The number of undergraduate students has increased by 347 and the graduate enrollment has increased by 197 over past 10 years.
The female to male ratio is 1.67 to 1 and it means that there are more female students enrolled in George Fox than male students.
The following table and chart illustrate the changes in student population by gender at George Fox University since 2012.
| Year | Total | Undergraduate | Graduate | ||||
|---|---|---|---|---|---|---|---|
| Total | Men | Women | Total | Men | Women | ||
| 2012-13 | 3,484 | 2,184 | 888 | 1,296 | 1,300 | 574 | 726 |
| 2013-14 | 3,712 228 | 2,384 200 | 1,018 130 | 1,366 70 | 1,328 28 | 594 20 | 734 8 |
| 2014-15 | 3,786 74 | 2,509 125 | 1,097 79 | 1,412 46 | 1,277 -51 | 553 -41 | 724 -10 |
| 2015-16 | 3,925 139 | 2,587 78 | 1,137 40 | 1,450 38 | 1,338 61 | 559 6 | 779 55 |
| 2016-17 | 4,139 214 | 2,707 120 | 1,201 64 | 1,506 56 | 1,432 94 | 579 20 | 853 74 |
| 2017-18 | 4,076 -63 | 2,698 -9 | 1,172 -29 | 1,526 20 | 1,378 -54 | 533 -46 | 845 -8 |
| 2018-19 | 3,941 -135 | 2,671 -27 | 1,112 -60 | 1,559 33 | 1,270 -108 | 469 -64 | 801 -44 |
| 2019-20 | 4,063 122 | 2,629 -42 | 1,106 -6 | 1,523 -36 | 1,434 164 | 503 34 | 931 130 |
| 2020-21 | 4,106 43 | 2,481 -148 | 989 -117 | 1,492 -31 | 1,625 191 | 535 32 | 1,090 159 |
| 2021-22 | 4,285 179 | 2,559 78 | 998 9 | 1,561 69 | 1,726 101 | 542 7 | 1,184 94 |
| 2022-23 | 4,028 -257 | 2,531 -28 | 1,016 18 | 1,515 -46 | 1,497 -229 | 492 -50 | 1,005 -179 |
| Average | 3,959 | 2,540 | 1,067 | 1,473 | 1,419 | 539 | 879 |