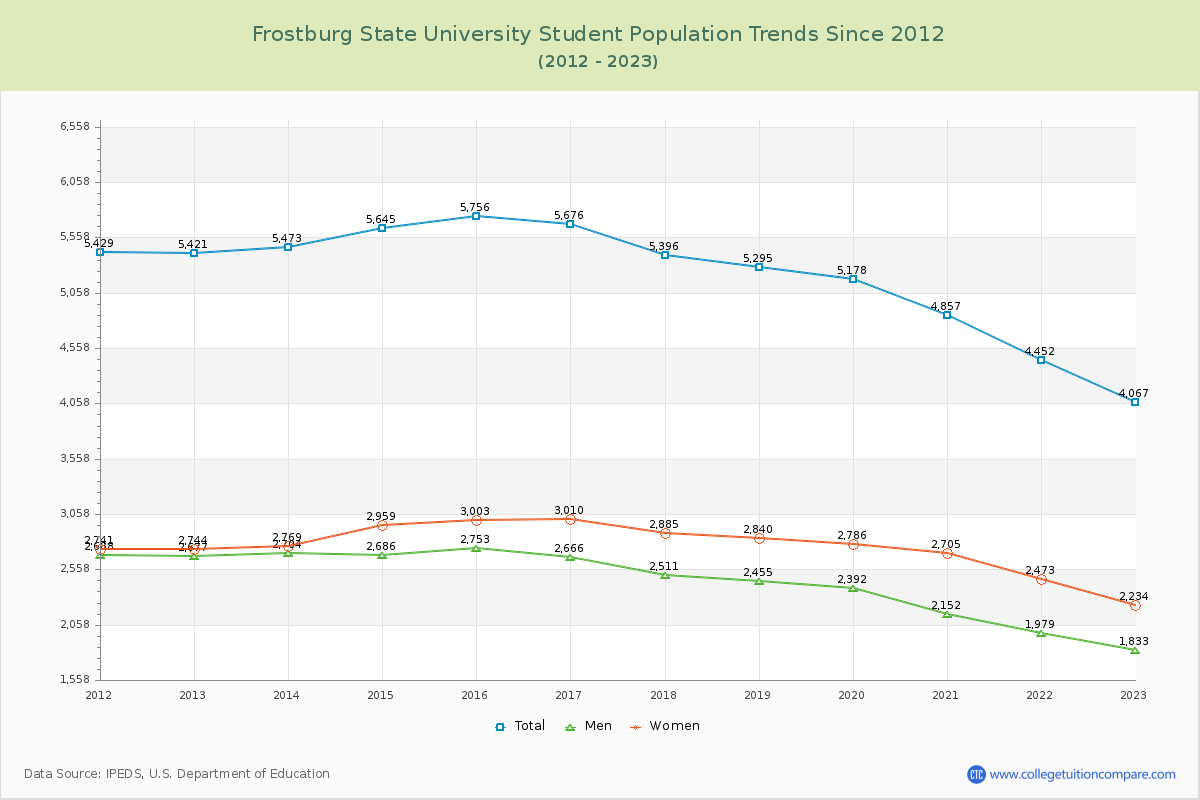
Student Population Changes
The average student population over the last 12 years is 5,201 where 4,067 students are attending the school for the academic year 2022-2023.
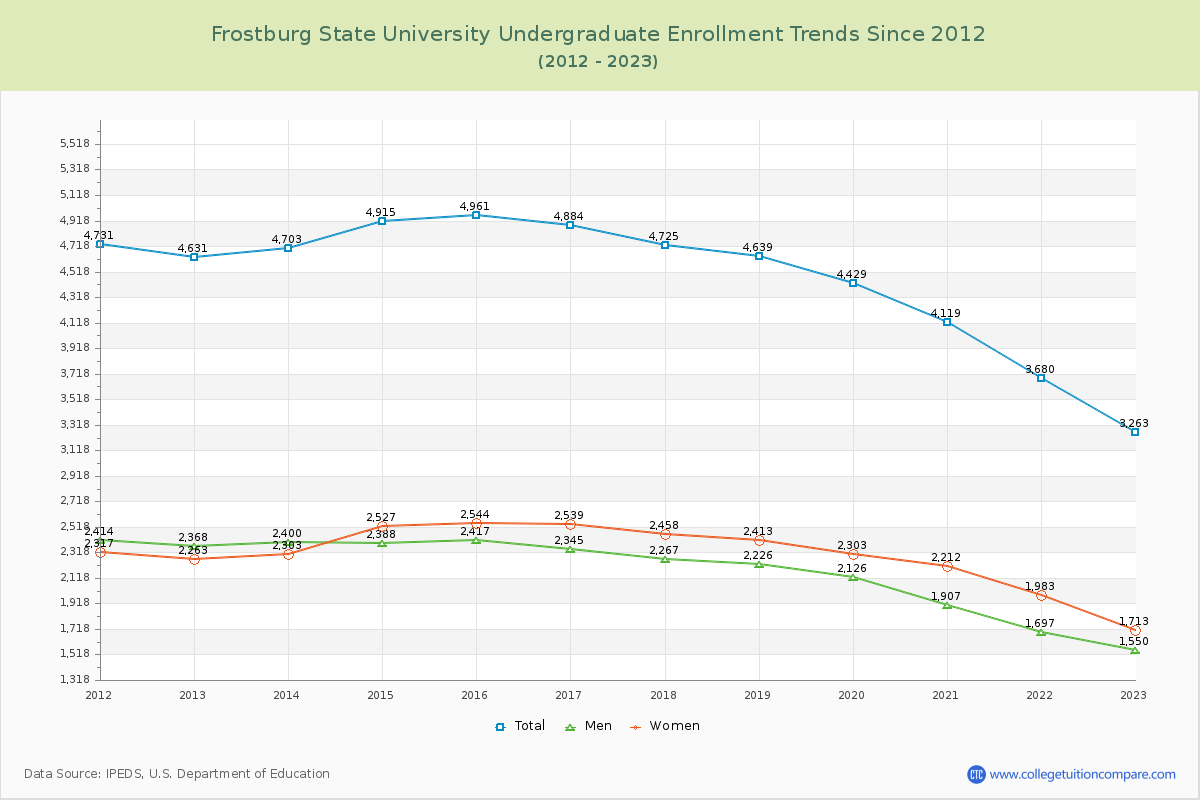
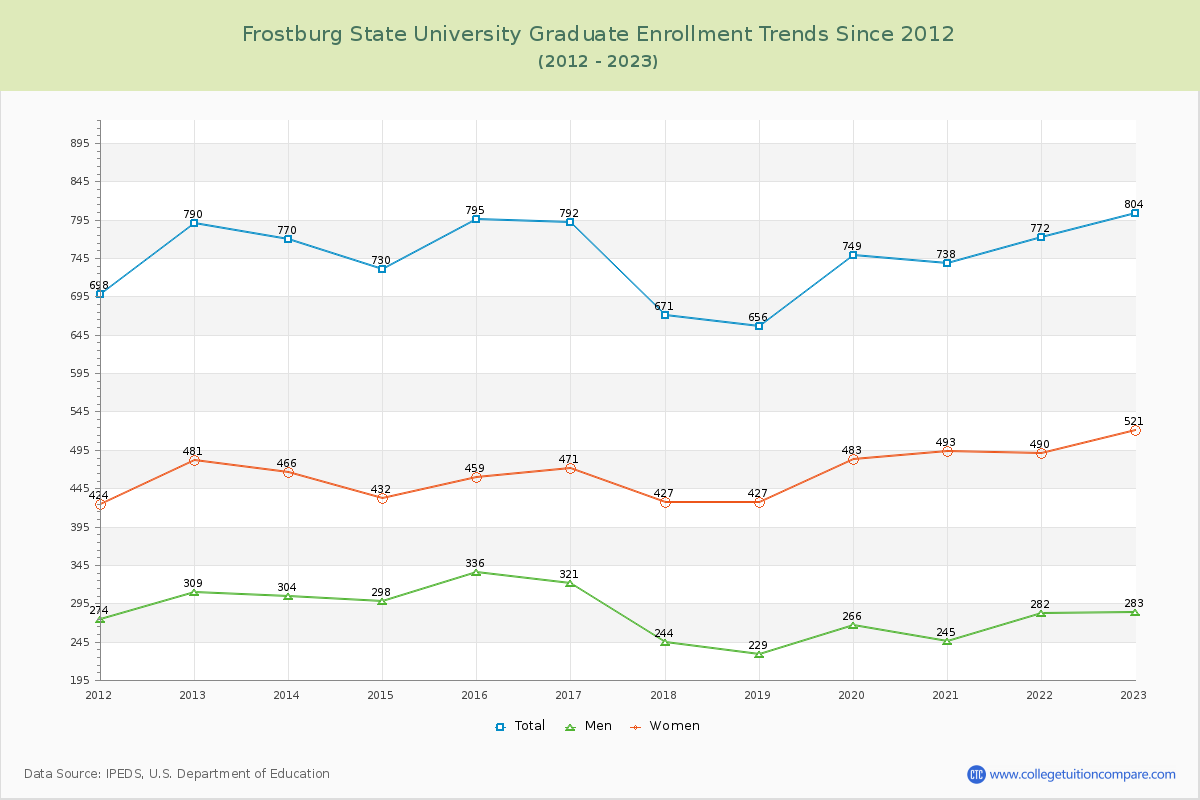
80.23% of total students is undergraduate students and 19.77% students is graduate students. The number of undergraduate students has decreased by 1,368 and the graduate enrollment has increased by 14 over past 10 years.
The female to male ratio is 1.22 to 1 and it means that there are slightly more female students enrolled in Frostburg State than male students.
The following table and chart illustrate the changes in student population by gender at Frostburg State University since 2012.
| Year | Total | Undergraduate | Graduate | ||||
|---|---|---|---|---|---|---|---|
| Total | Men | Women | Total | Men | Women | ||
| 2012-13 | 5,421 | 4,631 | 2,368 | 2,263 | 790 | 309 | 481 |
| 2013-14 | 5,473 52 | 4,703 72 | 2,400 32 | 2,303 40 | 770 -20 | 304 -5 | 466 -15 |
| 2014-15 | 5,645 172 | 4,915 212 | 2,388 -12 | 2,527 224 | 730 -40 | 298 -6 | 432 -34 |
| 2015-16 | 5,756 111 | 4,961 46 | 2,417 29 | 2,544 17 | 795 65 | 336 38 | 459 27 |
| 2016-17 | 5,676 -80 | 4,884 -77 | 2,345 -72 | 2,539 -5 | 792 -3 | 321 -15 | 471 12 |
| 2017-18 | 5,396 -280 | 4,725 -159 | 2,267 -78 | 2,458 -81 | 671 -121 | 244 -77 | 427 -44 |
| 2018-19 | 5,295 -101 | 4,639 -86 | 2,226 -41 | 2,413 -45 | 656 -15 | 229 -15 | 427 0 |
| 2019-20 | 5,178 -117 | 4,429 -210 | 2,126 -100 | 2,303 -110 | 749 93 | 266 37 | 483 56 |
| 2020-21 | 4,857 -321 | 4,119 -310 | 1,907 -219 | 2,212 -91 | 738 -11 | 245 -21 | 493 10 |
| 2021-22 | 4,452 -405 | 3,680 -439 | 1,697 -210 | 1,983 -229 | 772 34 | 282 37 | 490 -3 |
| 2022-23 | 4,067 -385 | 3,263 -417 | 1,550 -147 | 1,713 -270 | 804 32 | 283 1 | 521 31 |
| Average | 5,201 | 4,450 | 2,154 | 2,296 | 752 | 283 | 468 |