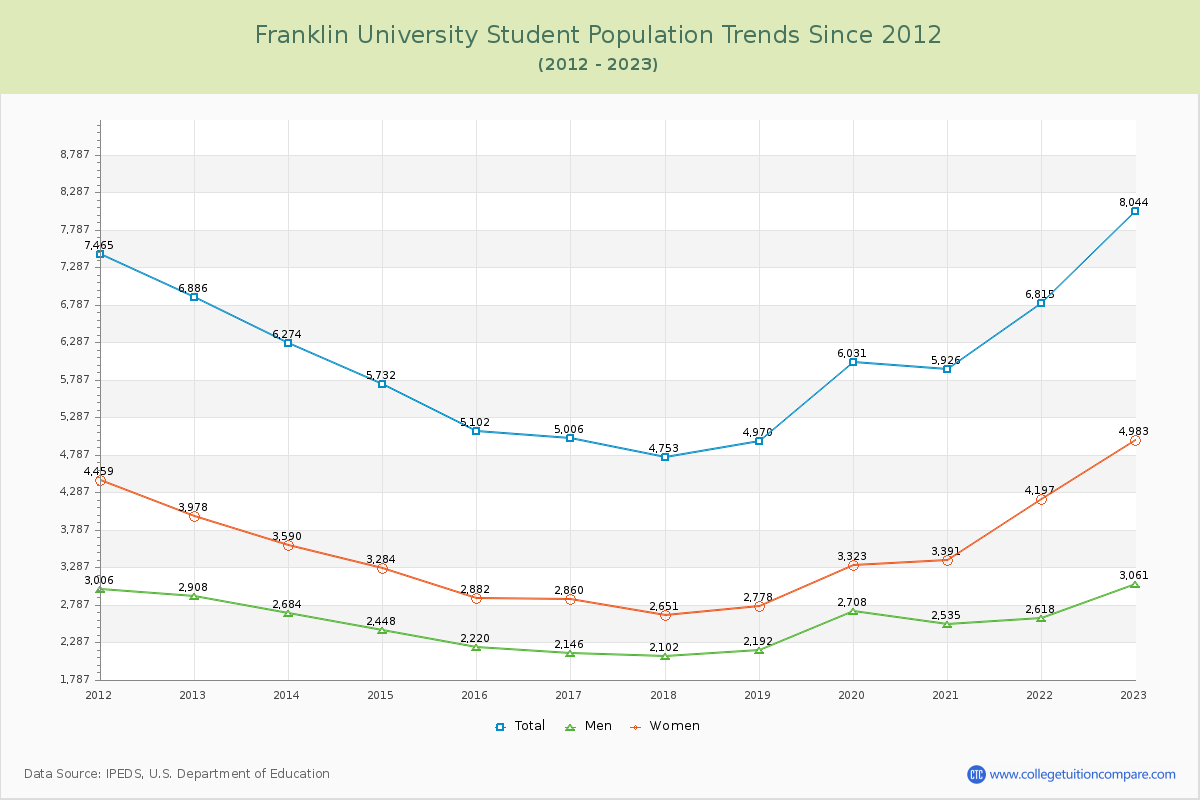
Student Population Changes
The average student population over the last 12 years is 5,958 where 8,044 students are attending the school for the academic year 2022-2023.
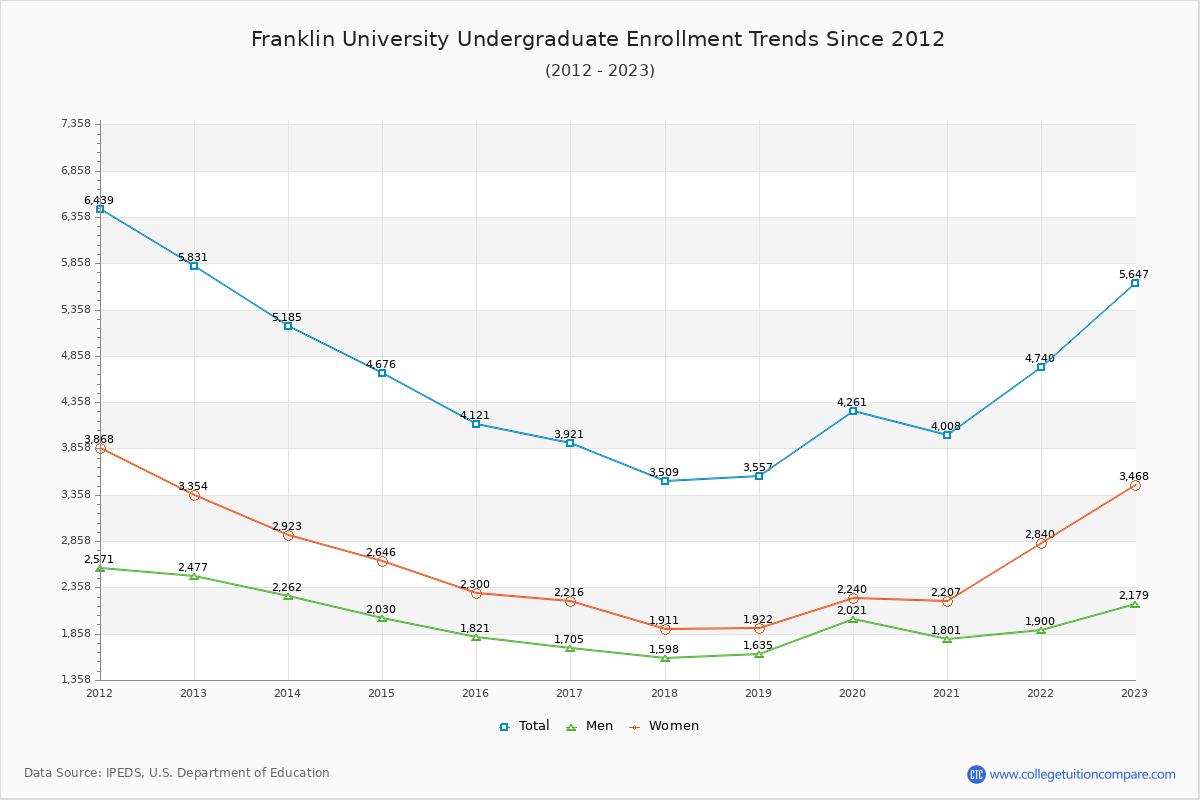
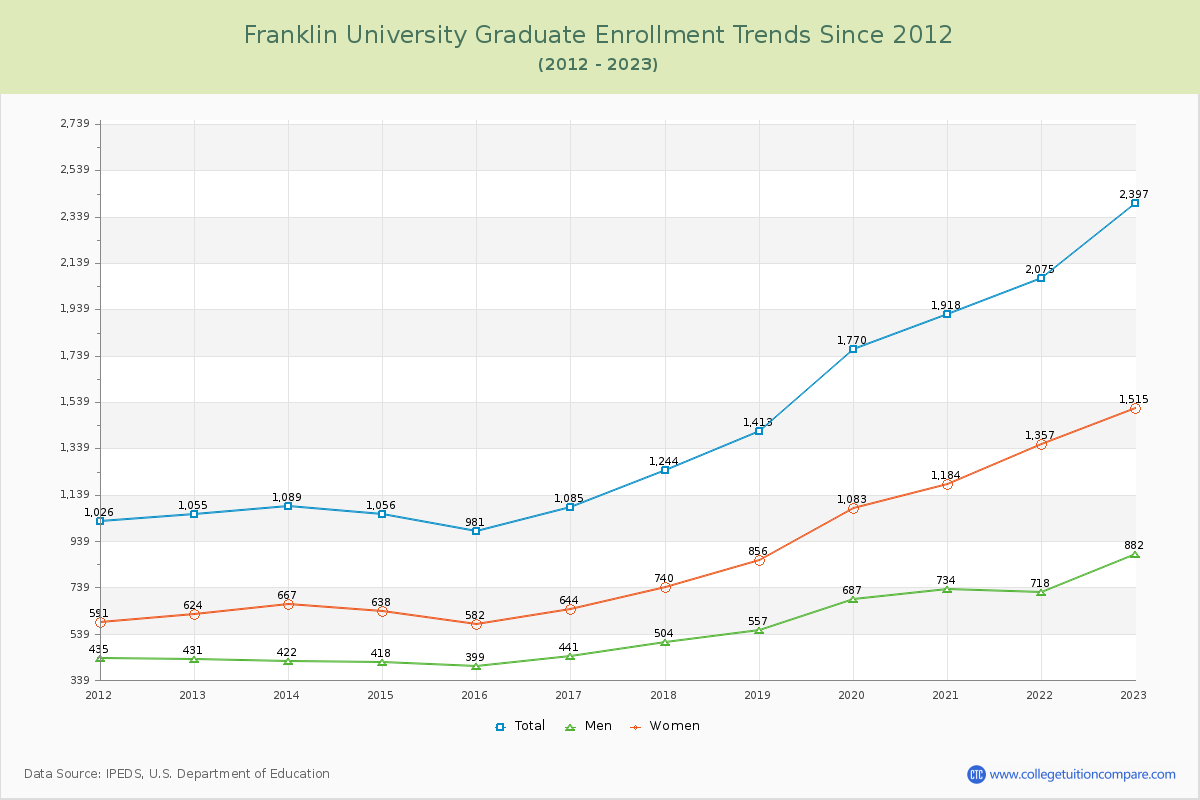
70.20% of total students is undergraduate students and 29.80% students is graduate students. The number of undergraduate students has decreased by 184 and the graduate enrollment has increased by 1,342 over past 10 years.
The female to male ratio is 1.63 to 1 and it means that there are more female students enrolled in Franklin than male students.
The following table and chart illustrate the changes in student population by gender at Franklin University since 2012.
| Year | Total | Undergraduate | Graduate | ||||
|---|---|---|---|---|---|---|---|
| Total | Men | Women | Total | Men | Women | ||
| 2012-13 | 6,886 | 5,831 | 2,477 | 3,354 | 1,055 | 431 | 624 |
| 2013-14 | 6,274 -612 | 5,185 -646 | 2,262 -215 | 2,923 -431 | 1,089 34 | 422 -9 | 667 43 |
| 2014-15 | 5,732 -542 | 4,676 -509 | 2,030 -232 | 2,646 -277 | 1,056 -33 | 418 -4 | 638 -29 |
| 2015-16 | 5,102 -630 | 4,121 -555 | 1,821 -209 | 2,300 -346 | 981 -75 | 399 -19 | 582 -56 |
| 2016-17 | 5,006 -96 | 3,921 -200 | 1,705 -116 | 2,216 -84 | 1,085 104 | 441 42 | 644 62 |
| 2017-18 | 4,753 -253 | 3,509 -412 | 1,598 -107 | 1,911 -305 | 1,244 159 | 504 63 | 740 96 |
| 2018-19 | 4,970 217 | 3,557 48 | 1,635 37 | 1,922 11 | 1,413 169 | 557 53 | 856 116 |
| 2019-20 | 6,031 1,061 | 4,261 704 | 2,021 386 | 2,240 318 | 1,770 357 | 687 130 | 1,083 227 |
| 2020-21 | 5,926 -105 | 4,008 -253 | 1,801 -220 | 2,207 -33 | 1,918 148 | 734 47 | 1,184 101 |
| 2021-22 | 6,815 889 | 4,740 732 | 1,900 99 | 2,840 633 | 2,075 157 | 718 -16 | 1,357 173 |
| 2022-23 | 8,044 1,229 | 5,647 907 | 2,179 279 | 3,468 628 | 2,397 322 | 882 164 | 1,515 158 |
| Average | 5,958 | 4,496 | 1,948 | 2,548 | 1,462 | 563 | 899 |