Student Population by Gender
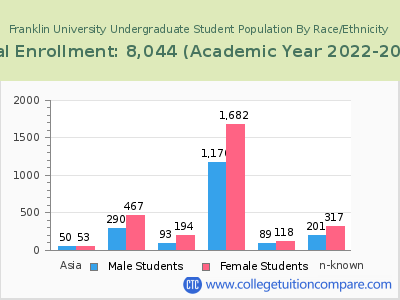
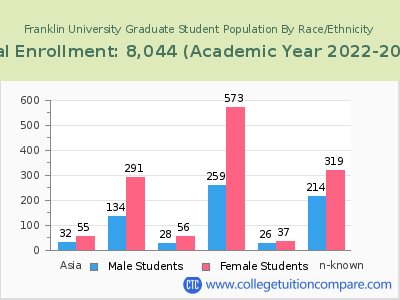
Franklin University has a total of 8,044 enrolled students for the academic year 2022-2023. 5,647 students have enrolled in undergraduate programs and 2,397 students joined graduate programs.
By gender, 3,061 male and 4,983 female students (the male-female ratio is 38:62) are attending the school. The gender distribution is based on the 2022-2023 data.
| Total | Undergraduate | Graduate | |
|---|---|---|---|
| Total | 8,044 | 5,647 | 2,397 |
| Men | 3,061 | 2,179 | 882 |
| Women | 4,983 | 3,468 | 1,515 |
Student Distribution by Race/Ethnicity
| Race | Total | Men | Women |
|---|---|---|---|
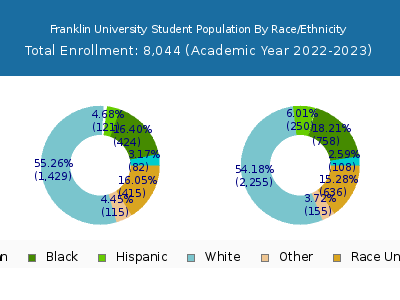
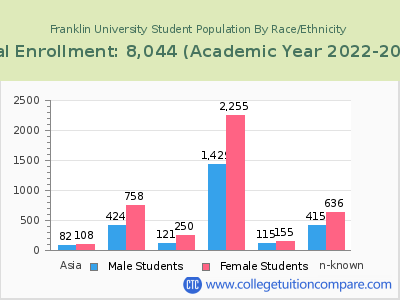
| American Indian or Native American | 65 | 24 | 41 |
| Asian | 264 | 121 | 143 |
| Black | 1,527 | 512 | 1,015 |
| Hispanic | 569 | 194 | 375 |
| Native Hawaiian or Other Pacific Islanders | 16 | 3 | 13 |
| White | 4,460 | 1,721 | 2,739 |
| Two or more races | 242 | 94 | 148 |
| Race Unknown | 661 | 242 | 419 |
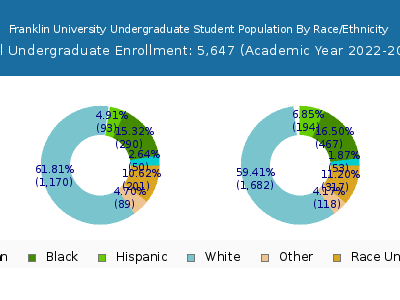
| Race | Total | Men | Women |
|---|---|---|---|
| American Indian or Native American | 45 | 19 | 26 |
| Asian | 145 | 70 | 75 |
| Black | 995 | 349 | 646 |
| Hispanic | 467 | 157 | 310 |
| Native Hawaiian or Other Pacific Islanders | 12 | 3 | 9 |
| White | 3,423 | 1,366 | 2,057 |
| Two or more races | 194 | 78 | 116 |
| Race Unknown | 354 | 130 | 224 |
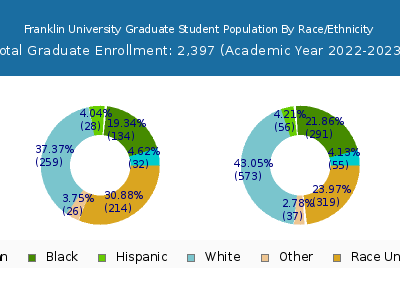
| Race | Total | Men | Women |
|---|---|---|---|
| American Indian or Native American | 9 | 4 | 5 |
| Asian | 27 | 9 | 18 |
| Black | 208 | 83 | 125 |
| Hispanic | 69 | 20 | 49 |
| Native Hawaiian or Other Pacific Islanders | 1 | 0 | 1 |
| White | 596 | 238 | 358 |
| Two or more races | 40 | 17 | 23 |
| Race Unknown | 28 | 13 | 15 |
Online Student Enrollment
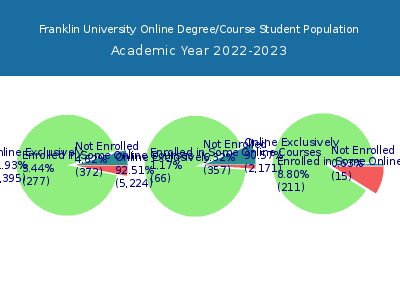
Distance learning, also called online education, is very attractive to students, especially who want to continue education and work in field. At Franklin University, 7,395 students are enrolled exclusively in online courses and 277 students are enrolled in some online courses.
4,616 students lived in Ohio or jurisdiction in which the school is located are enrolled exclusively in online courses and 2,779 students live in other State or outside of the United States.
| All Students | Enrolled Exclusively Online Courses | Enrolled in Some Online Courses | |
|---|---|---|---|
| All Students | 8,044 | 7,395 | 277 |
| Undergraduate | 5,647 | 5,224 | 66 |
| Graduate | 2,397 | 2,171 | 211 |
| Ohio Residents | Other States in U.S. | Outside of U.S. | |
|---|---|---|---|
| All Students | 4,616 | 2,733 | 46 |
| Undergraduate | 3,232 | 1,946 | 46 |
| Graduate | 1,384 | 787 | 0 |
Transfer-in Students (Undergraduate)
Among 5,647 enrolled in undergraduate programs, 981 students have transferred-in from other institutions. The percentage of transfer-in students is 17.37%.274 students have transferred in as full-time status and 707 students transferred in as part-time status.
| Number of Students | |
|---|---|
| Regular Full-time | 1,716 |
| Transfer-in Full-time | 274 |
| Regular Part-time | 2,950 |
| Transfer-in Part-time | 707 |
