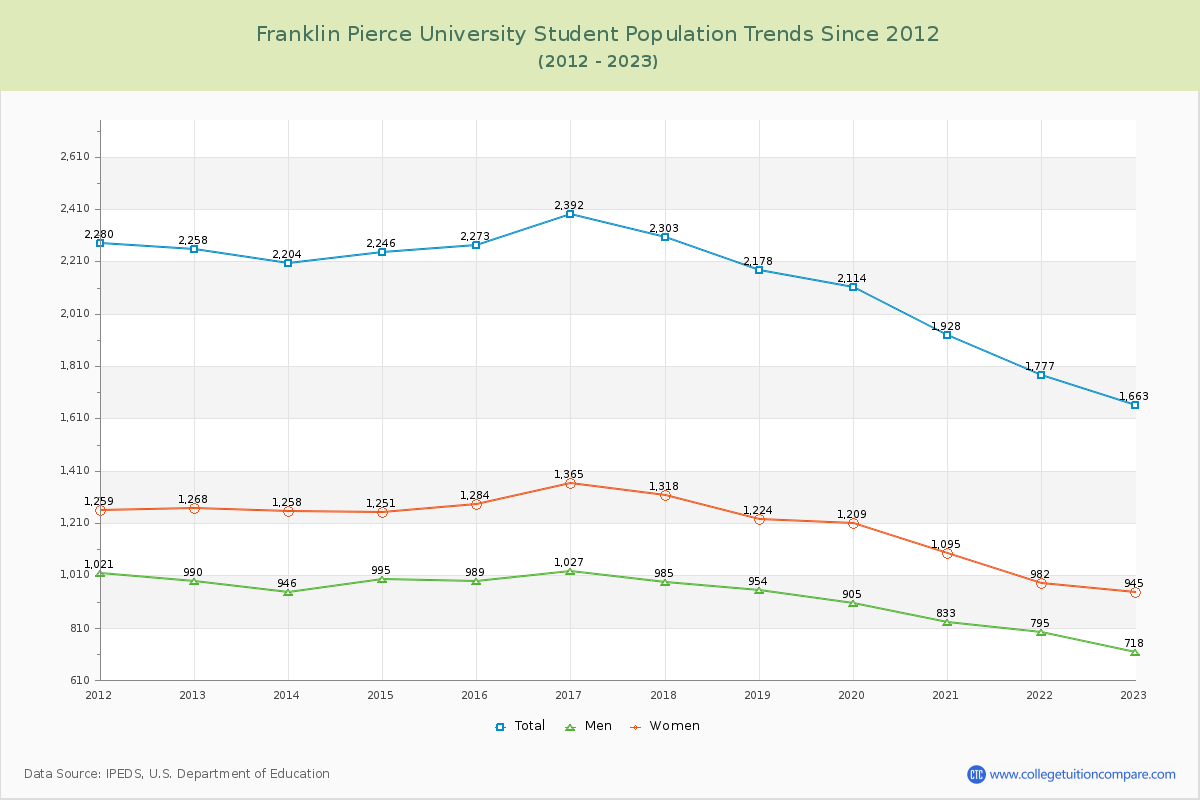
Student Population Changes
The average student population over the last 12 years is 2,121 where 1,663 students are attending the school for the academic year 2022-2023.
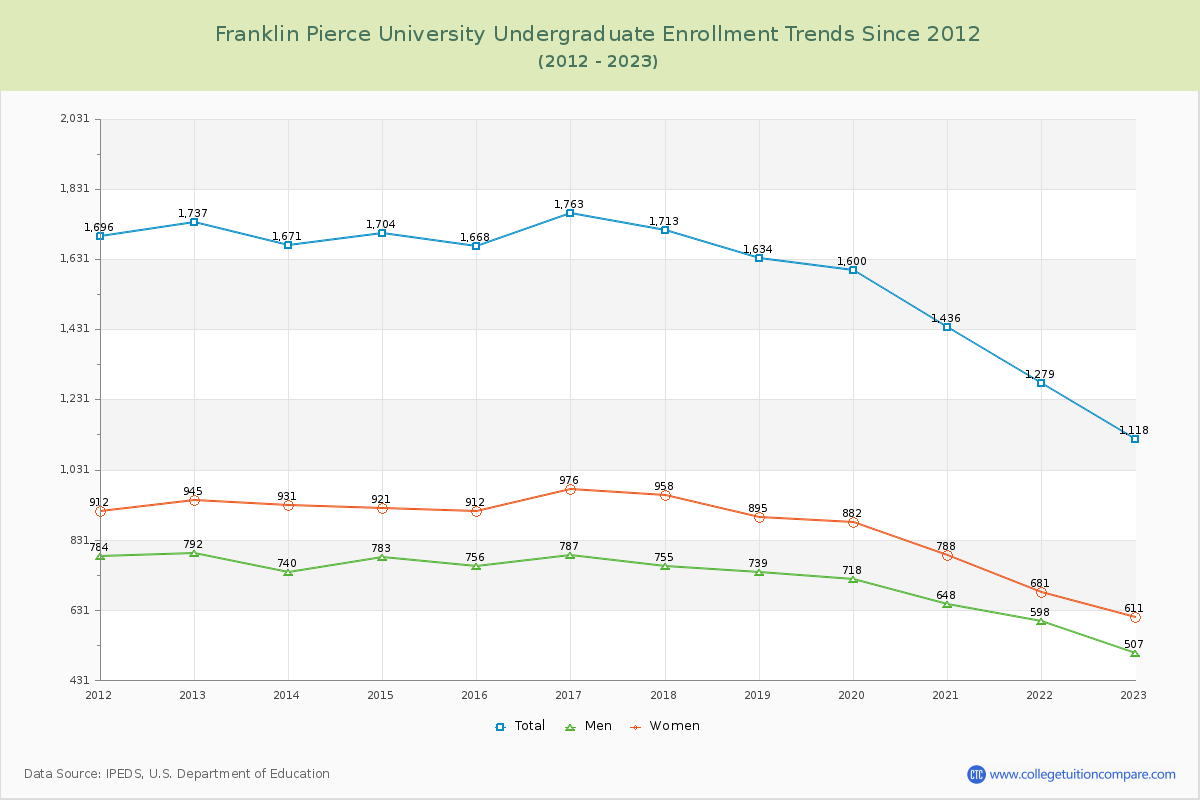
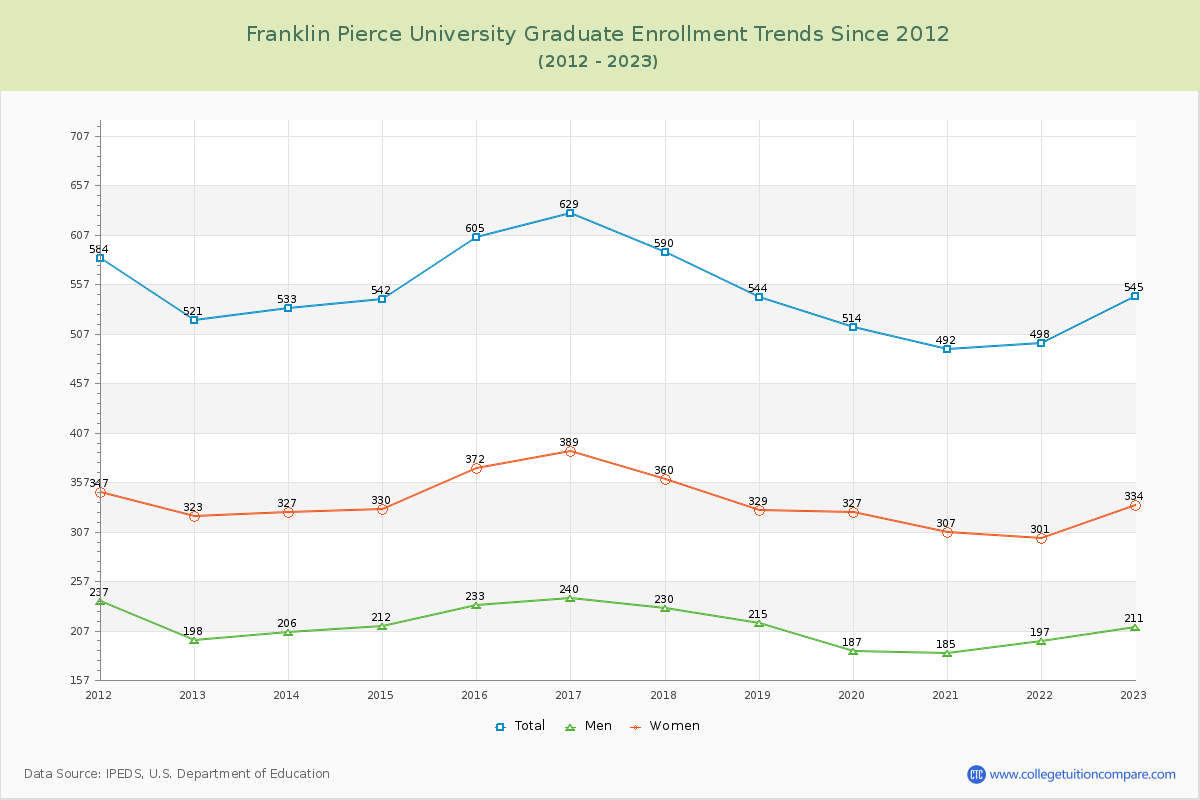
67.23% of total students is undergraduate students and 32.77% students is graduate students. The number of undergraduate students has decreased by 619 and the graduate enrollment has increased by 24 over past 10 years.
The female to male ratio is 1.32 to 1 and it means that there are more female students enrolled in FPU than male students.
The following table and chart illustrate the changes in student population by gender at Franklin Pierce University since 2012.
| Year | Total | Undergraduate | Graduate | ||||
|---|---|---|---|---|---|---|---|
| Total | Men | Women | Total | Men | Women | ||
| 2012-13 | 2,258 | 1,737 | 792 | 945 | 521 | 198 | 323 |
| 2013-14 | 2,204 -54 | 1,671 -66 | 740 -52 | 931 -14 | 533 12 | 206 8 | 327 4 |
| 2014-15 | 2,246 42 | 1,704 33 | 783 43 | 921 -10 | 542 9 | 212 6 | 330 3 |
| 2015-16 | 2,273 27 | 1,668 -36 | 756 -27 | 912 -9 | 605 63 | 233 21 | 372 42 |
| 2016-17 | 2,392 119 | 1,763 95 | 787 31 | 976 64 | 629 24 | 240 7 | 389 17 |
| 2017-18 | 2,303 -89 | 1,713 -50 | 755 -32 | 958 -18 | 590 -39 | 230 -10 | 360 -29 |
| 2018-19 | 2,178 -125 | 1,634 -79 | 739 -16 | 895 -63 | 544 -46 | 215 -15 | 329 -31 |
| 2019-20 | 2,114 -64 | 1,600 -34 | 718 -21 | 882 -13 | 514 -30 | 187 -28 | 327 -2 |
| 2020-21 | 1,928 -186 | 1,436 -164 | 648 -70 | 788 -94 | 492 -22 | 185 -2 | 307 -20 |
| 2021-22 | 1,777 -151 | 1,279 -157 | 598 -50 | 681 -107 | 498 6 | 197 12 | 301 -6 |
| 2022-23 | 1,663 -114 | 1,118 -161 | 507 -91 | 611 -70 | 545 47 | 211 14 | 334 33 |
| Average | 2,121 | 1,575 | 711 | 864 | 547 | 210 | 336 |