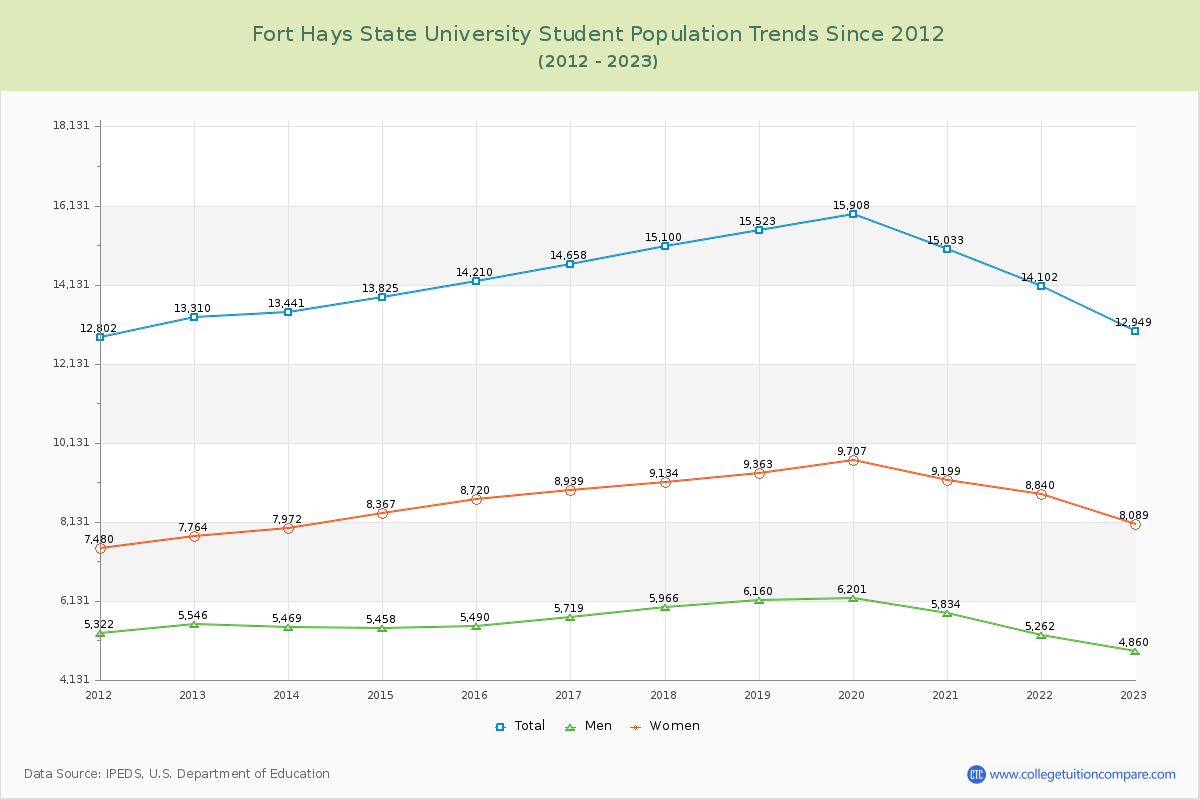
Student Population Changes
The average student population over the last 12 years is 14,369 where 12,949 students are attending the school for the academic year 2022-2023.
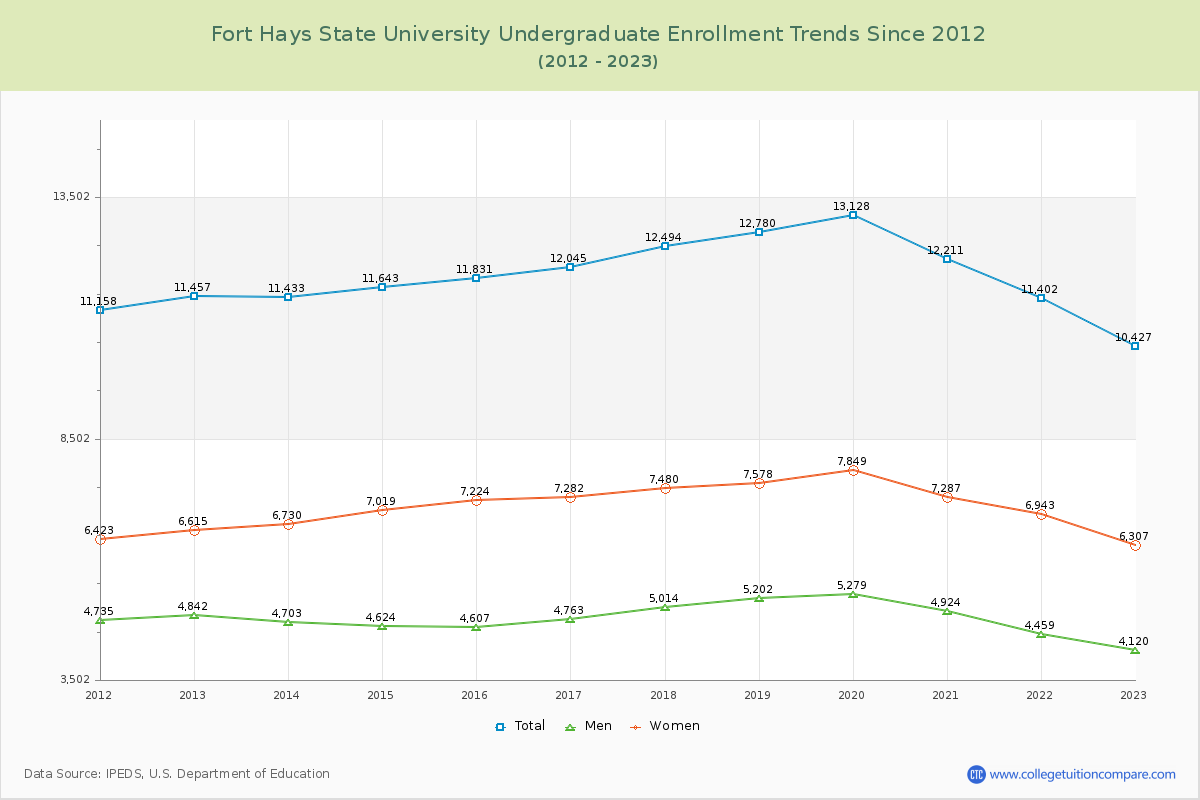
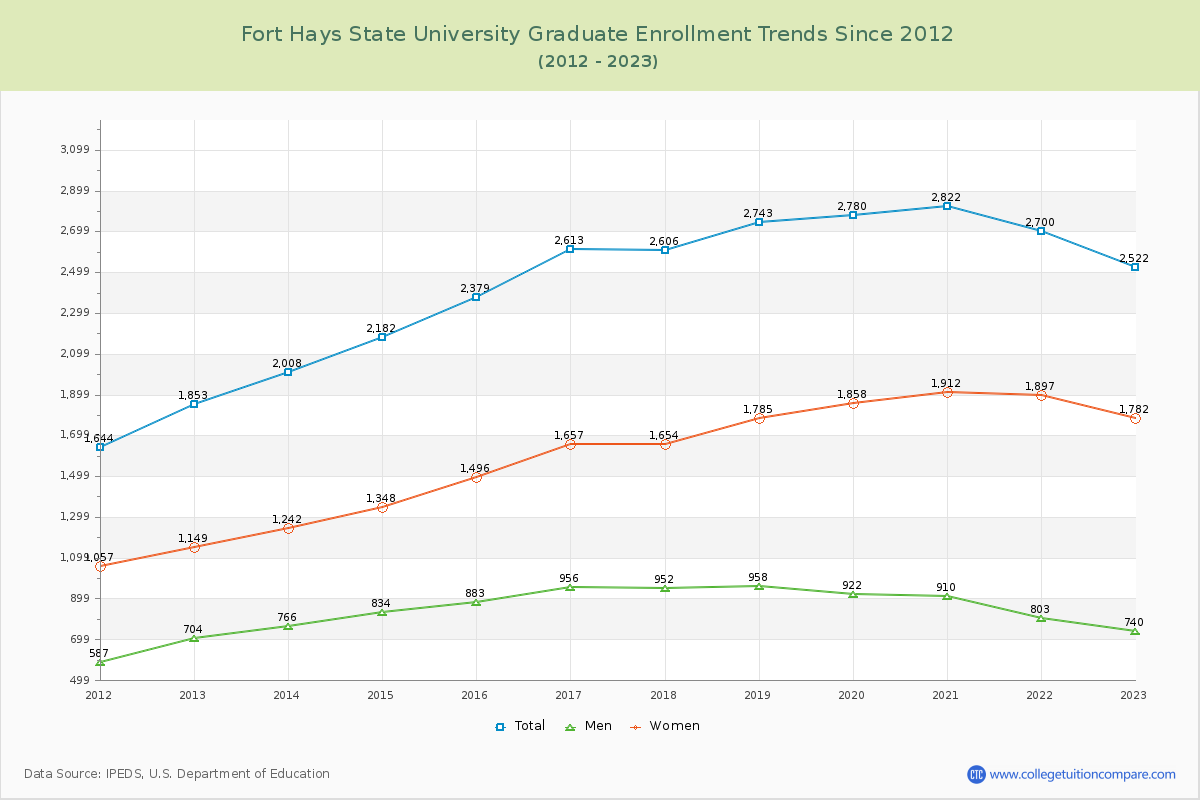
80.52% of total students is undergraduate students and 19.48% students is graduate students. The number of undergraduate students has decreased by 1,030 and the graduate enrollment has increased by 669 over past 10 years.
The female to male ratio is 1.66 to 1 and it means that there are more female students enrolled in FHSU than male students.
The following table and chart illustrate the changes in student population by gender at Fort Hays State University since 2012.
| Year | Total | Undergraduate | Graduate | ||||
|---|---|---|---|---|---|---|---|
| Total | Men | Women | Total | Men | Women | ||
| 2012-13 | 13,310 | 11,457 | 4,842 | 6,615 | 1,853 | 704 | 1,149 |
| 2013-14 | 13,441 131 | 11,433 -24 | 4,703 -139 | 6,730 115 | 2,008 155 | 766 62 | 1,242 93 |
| 2014-15 | 13,825 384 | 11,643 210 | 4,624 -79 | 7,019 289 | 2,182 174 | 834 68 | 1,348 106 |
| 2015-16 | 14,210 385 | 11,831 188 | 4,607 -17 | 7,224 205 | 2,379 197 | 883 49 | 1,496 148 |
| 2016-17 | 14,658 448 | 12,045 214 | 4,763 156 | 7,282 58 | 2,613 234 | 956 73 | 1,657 161 |
| 2017-18 | 15,100 442 | 12,494 449 | 5,014 251 | 7,480 198 | 2,606 -7 | 952 -4 | 1,654 -3 |
| 2018-19 | 15,523 423 | 12,780 286 | 5,202 188 | 7,578 98 | 2,743 137 | 958 6 | 1,785 131 |
| 2019-20 | 15,908 385 | 13,128 348 | 5,279 77 | 7,849 271 | 2,780 37 | 922 -36 | 1,858 73 |
| 2020-21 | 15,033 -875 | 12,211 -917 | 4,924 -355 | 7,287 -562 | 2,822 42 | 910 -12 | 1,912 54 |
| 2021-22 | 14,102 -931 | 11,402 -809 | 4,459 -465 | 6,943 -344 | 2,700 -122 | 803 -107 | 1,897 -15 |
| 2022-23 | 12,949 -1,153 | 10,427 -975 | 4,120 -339 | 6,307 -636 | 2,522 -178 | 740 -63 | 1,782 -115 |
| Average | 14,369 | 11,896 | 4,776 | 7,119 | 2,473 | 857 | 1,616 |