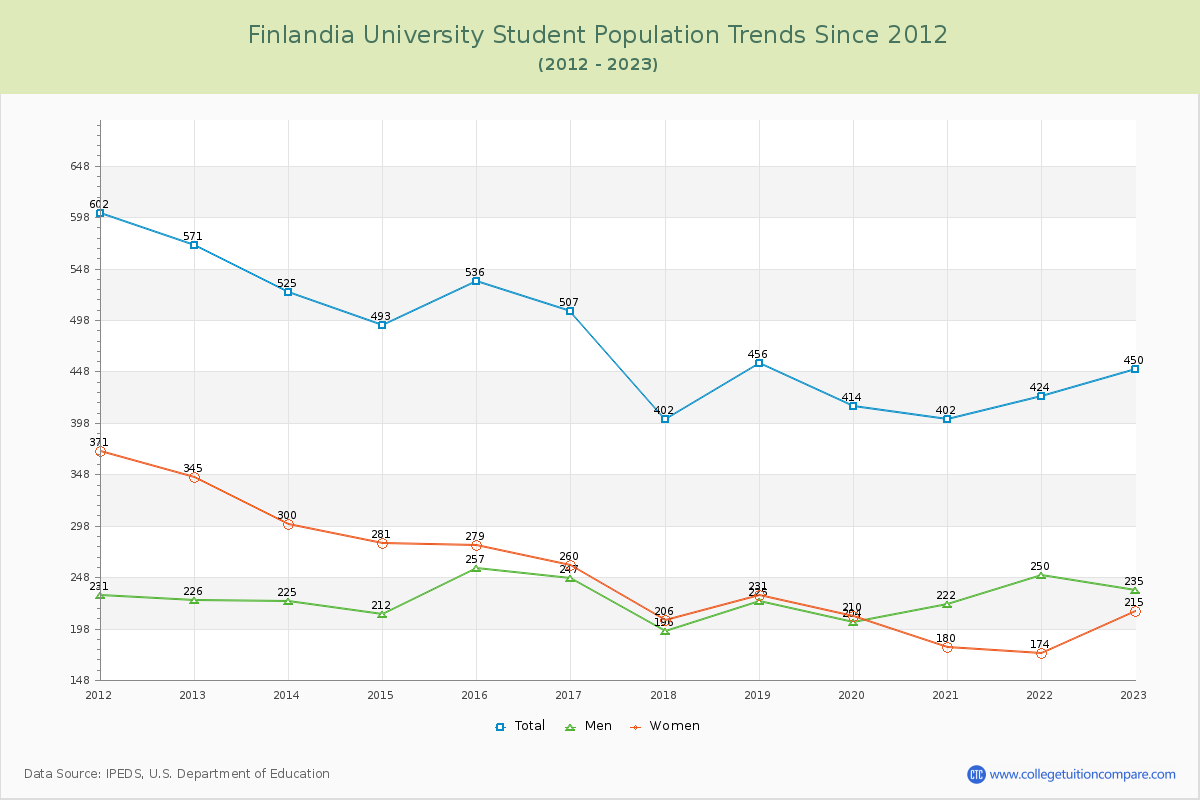
Student Population Changes
The average student population over the last 12 years is 471 where 450 students are attending the school for the academic year 2022-2023.
The female to male ratio is 0.91 to 1 and it means that there are similar numbers of female and male students enrolled in Finlandia.
The following table and chart illustrate the changes in student population by gender at Finlandia University since 2012.
| Year | Total | Men | Women |
|---|---|---|---|
| 2012-13 | 571 | 226 | 345 |
| 2013-14 | 525 -46 | 225 -1 | 300 -45 |
| 2014-15 | 493 -32 | 212 -13 | 281 -19 |
| 2015-16 | 536 43 | 257 45 | 279 -2 |
| 2016-17 | 507 -29 | 247 -10 | 260 -19 |
| 2017-18 | 402 -105 | 196 -51 | 206 -54 |
| 2018-19 | 456 54 | 225 29 | 231 25 |
| 2019-20 | 414 -42 | 204 -21 | 210 -21 |
| 2020-21 | 402 -12 | 222 18 | 180 -30 |
| 2021-22 | 424 22 | 250 28 | 174 -6 |
| 2022-23 | 450 26 | 235 -15 | 215 41 |
| Average | 471 | 227 | 244 |