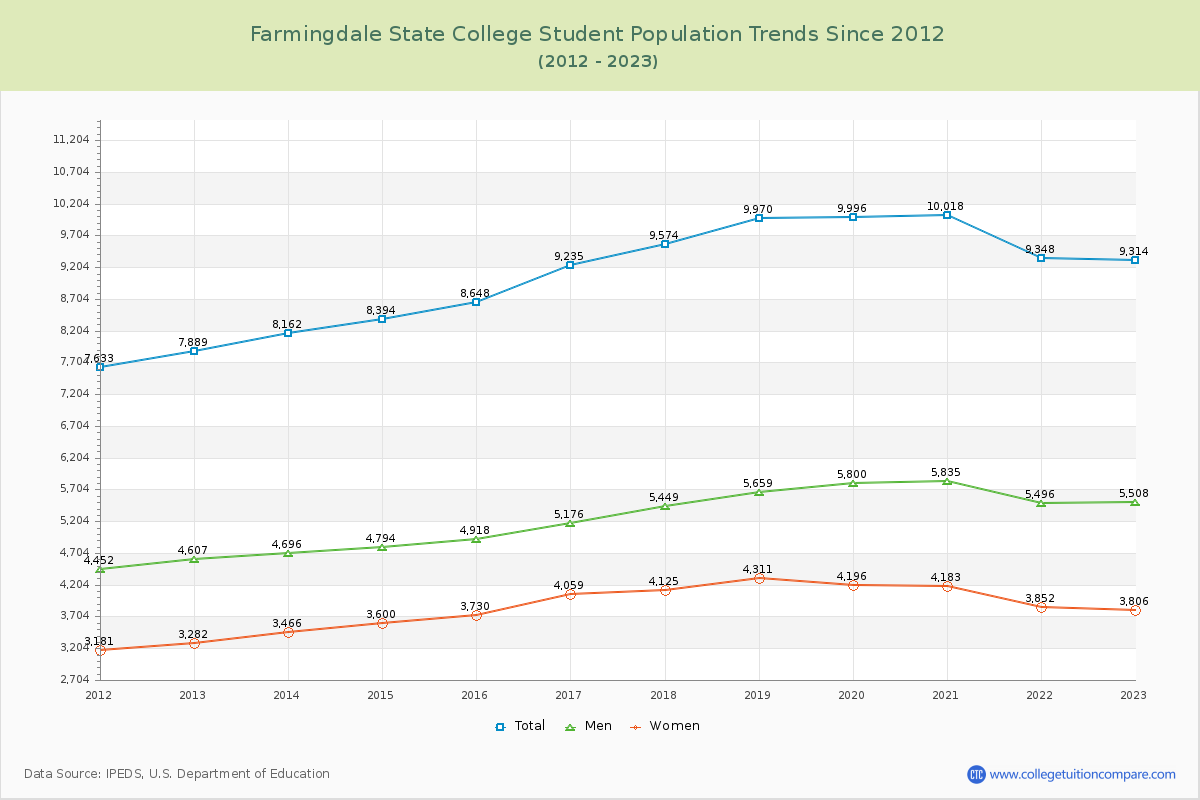
Student Population Changes
The average student population over the last 12 years is 9,141 where 9,314 students are attending the school for the academic year 2022-2023.
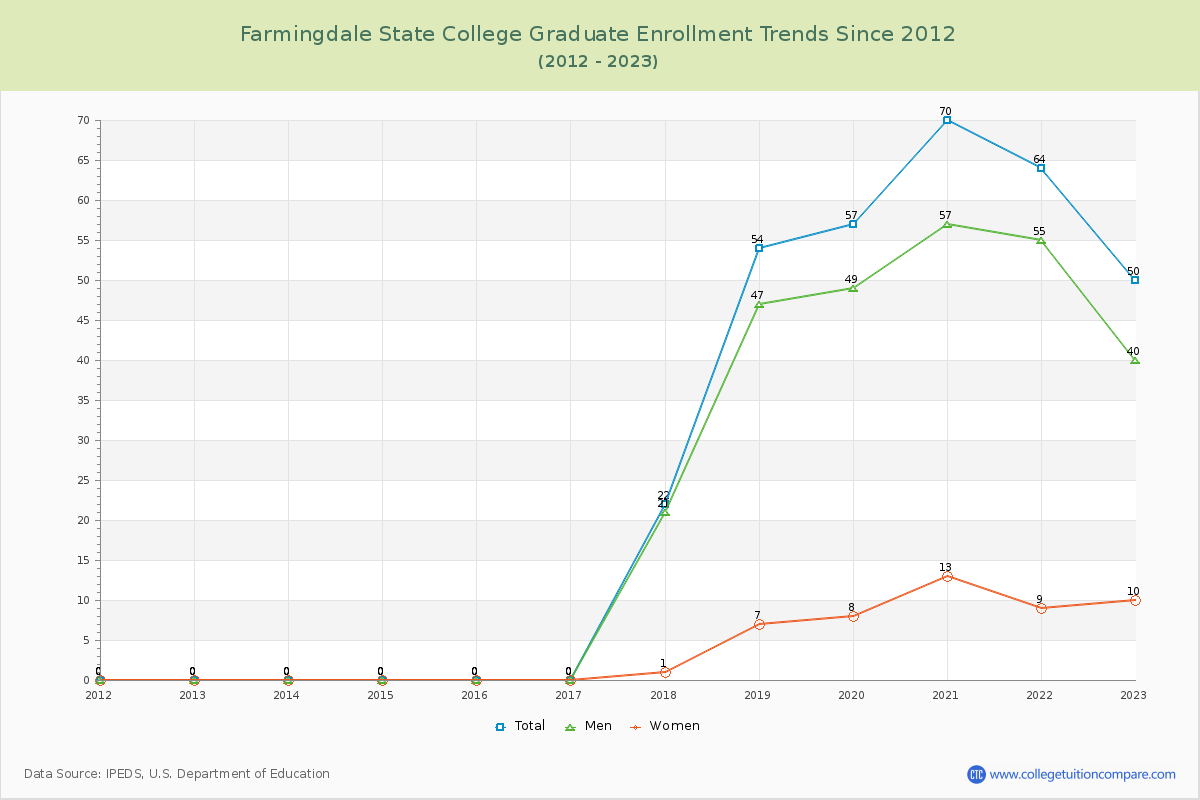
99.46% of total students is undergraduate students and 0.54% students is graduate students. The number of undergraduate students has increased by 1,375 and the graduate enrollment has increased by 50 over past 10 years.
The female to male ratio is 0.69 to 1 and it means that there are more male students enrolled in SUNY Farmingdale than female students.
The following table and chart illustrate the changes in student population by gender at Farmingdale State College since 2012.
| Year | Total | Undergraduate | Graduate | ||||
|---|---|---|---|---|---|---|---|
| Total | Men | Women | Total | Men | Women | ||
| 2012-13 | 7,889 | 7,889 | 4,607 | 3,282 | 0 | 0 | 0 |
| 2013-14 | 8,162 273 | 8,162 273 | 4,696 89 | 3,466 184 | 0 0 | 0 0 | 0 0 |
| 2014-15 | 8,394 232 | 8,394 232 | 4,794 98 | 3,600 134 | 0 0 | 0 0 | 0 0 |
| 2015-16 | 8,648 254 | 8,648 254 | 4,918 124 | 3,730 130 | 0 0 | 0 0 | 0 0 |
| 2016-17 | 9,235 587 | 9,235 587 | 5,176 258 | 4,059 329 | 0 0 | 0 0 | 0 0 |
| 2017-18 | 9,574 339 | 9,552 317 | 5,428 252 | 4,124 65 | 22 22 | 21 21 | 1 1 |
| 2018-19 | 9,970 396 | 9,916 364 | 5,612 184 | 4,304 180 | 54 32 | 47 26 | 7 6 |
| 2019-20 | 9,996 26 | 9,939 23 | 5,751 139 | 4,188 -116 | 57 3 | 49 2 | 8 1 |
| 2020-21 | 10,018 22 | 9,948 9 | 5,778 27 | 4,170 -18 | 70 13 | 57 8 | 13 5 |
| 2021-22 | 9,348 -670 | 9,284 -664 | 5,441 -337 | 3,843 -327 | 64 -6 | 55 -2 | 9 -4 |
| 2022-23 | 9,314 -34 | 9,264 -20 | 5,468 27 | 3,796 -47 | 50 -14 | 40 -15 | 10 1 |
| Average | 9,141 | 9,112 | 5,243 | 3,869 | 29 | 24 | 4 |